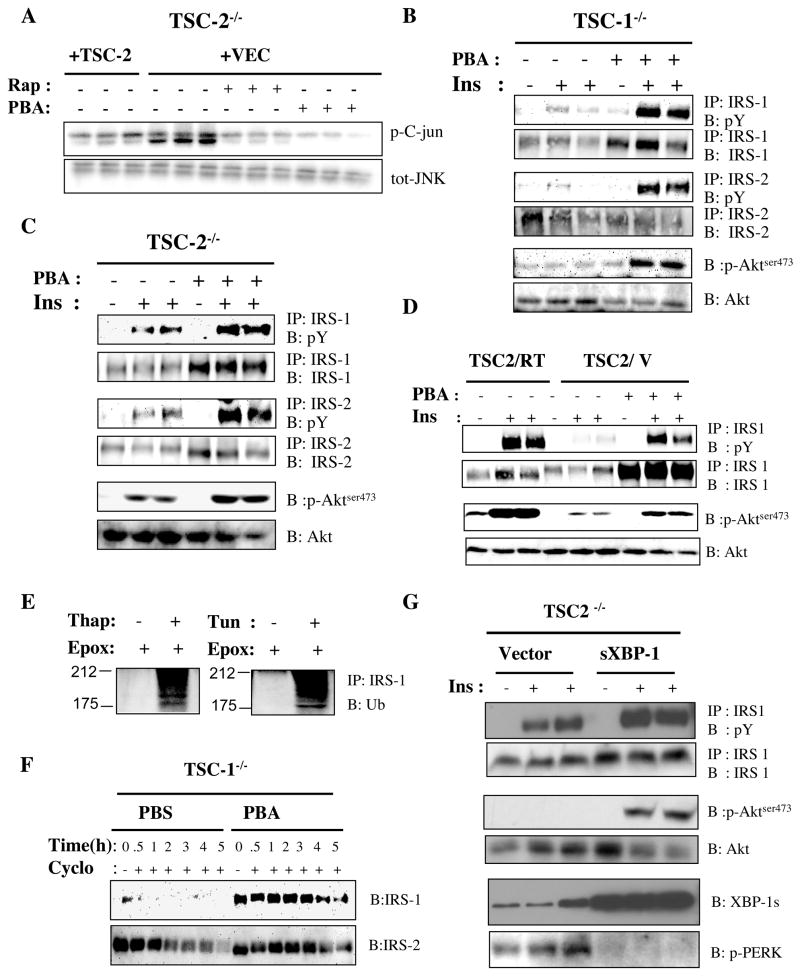
Figure 5. Role of UPR in development of insulin resistance in TSC1- and TSC2- deficient cells.
(A) IP-kinase assay on JNK activity in Tsc2−/− cells reconstituted either with an empty retroviral vector or a TSC2 expressing vector after vehicle, rapamycin (20 nM) and 4-PBA (10 mM) treatment for 24 hours, shown in triplicate. (B–C) Analysis of insulin stimulated tyrosine phosphorylation of IRS-1 and IRS-2, and phosphorylation of Akt (serine 473) in Tsc1−/− (B) and Tsc2−/− (C) cells in the absence or presence of 4-PBA (10mM) for 24 hours. (D) IRS-1 tyrosine and Akt (serine 473) phosphorylations in Tsc2−/− (+TSC2) and Tsc2−/− (+VEC) MEFs after 4-PBA treatment. (E) Ubiquitination of IRS-1 after 8 hours of Thapsigargin (300 nM) or Tun (2 μg/ml) treatment in the presence of epoximicin (1 μg/ml) (F) IRS-1 protein levels in the presence of cycloheximide (100 μg/ml) after 20 hours of 4-PBA (10 mM) pre-treatment of Tsc1−/− cells. (G). Decreased ER stress and recovery of insulin-stimulated IRS-1 and Akt phosphorylation in Tsc2−/− MEFs by expression of exogenous spliced XBP-1 (sXBP-1). sXBP-1 is introduced into the cells by an adenoviral expression system and the bottom panel shows the protein levels obtained in the cells. Phosphorylation of PERK is examined to monitor ER stress.

