Figure 5.
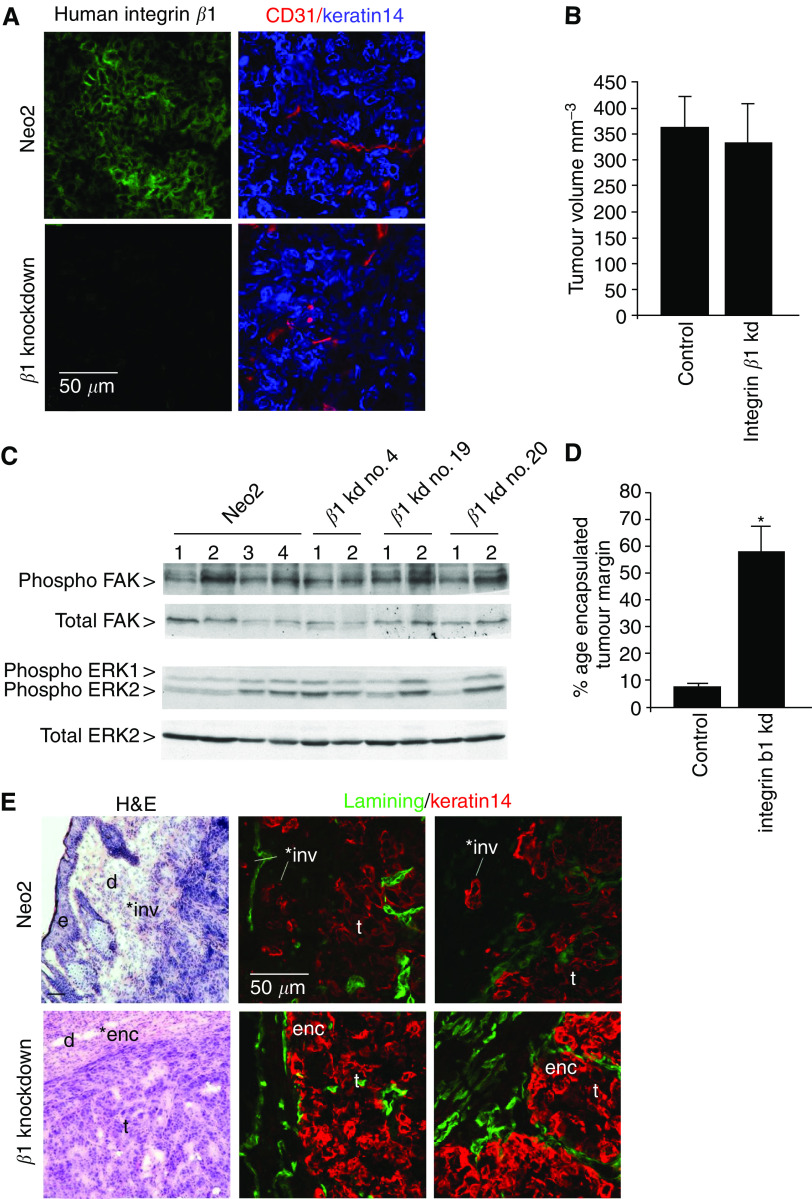
Analysis of integrin β1 function in tumours in vivo. (A) Frozen sections of tumours formed by control A431 cells or integrin β1 knockdown cells were stained for integrin β1 (left panels, P5D2 antibody), keratin 14 (right panels, blue) and CD31 (right panels, red). (B) 106 control A431 cells or integrin β1 knockdown cells were injected subcutaneously into nude mice. The average tumour volume after 15 days is shown (the data for the three integrin β1 knockdown clones were pooled, no statistically significant differences were observed between the three integrin β1 knockdown clones). (C) Lysates were made from tumours formed by control A431 cells or integrin β1 knockdown cells and analysed by Western blotting for ERK1/2 and FAK activity. Upper panel shows phospho-FAK Y397 immunoblot, upper-mid panel shows total FAK immunoblot, lower-mid panel shows phospho-ERK1/2 T283 and Y285 immunoblot, and lower panel shows total ERK2 immunoblot. (D) The proportion of encapsulated or invasive tumour boundary (scored blind) is shown for control and integrin β1 knockdown tumours. *Indicates a statistically significant difference from control (P<0.05). (E) Frozen sections of tumour margins from control A431 cells (upper panels) or integrin β1 knockdown clone 19 cells (lower panels) were stained with haematoxylin and eosin (left) or for laminin and keratin 14 (middle and right). ‘*inv’ indicates invasive margin, ‘*enc’ indicates encapsualted margin, ‘d’ – dermis, ‘e’ – host epidermis, ‘t’ – tumour.

