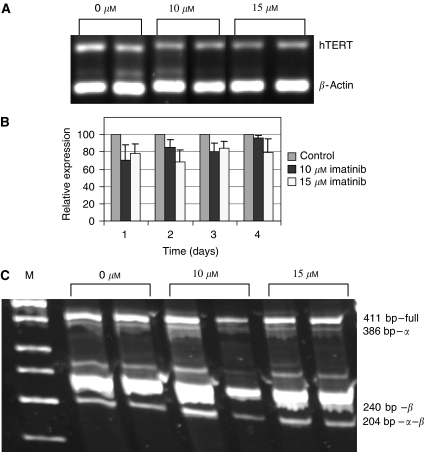
Figure 3.
Transcription regulation of hTERT in SK-N-MC cells exposed to imatinib. hTERT expression was evaluated by RT–PCR, using primers homologous to the total gene transcript. The alternative spliced variants were amplified using primers homologous to the two splice sites of the gene mRNA molecule, namely α and β. (A) An example of hTERT total transcript expression (after 72 h of imatinib treatment). (B) Quantification of the hTERT expression (an average of four experiments). (C) Alternative splicing of hTERT (after 72 h of imatinib treatment). Sizes of the various splice forms are indicated on the right. M: molecular size marker.

