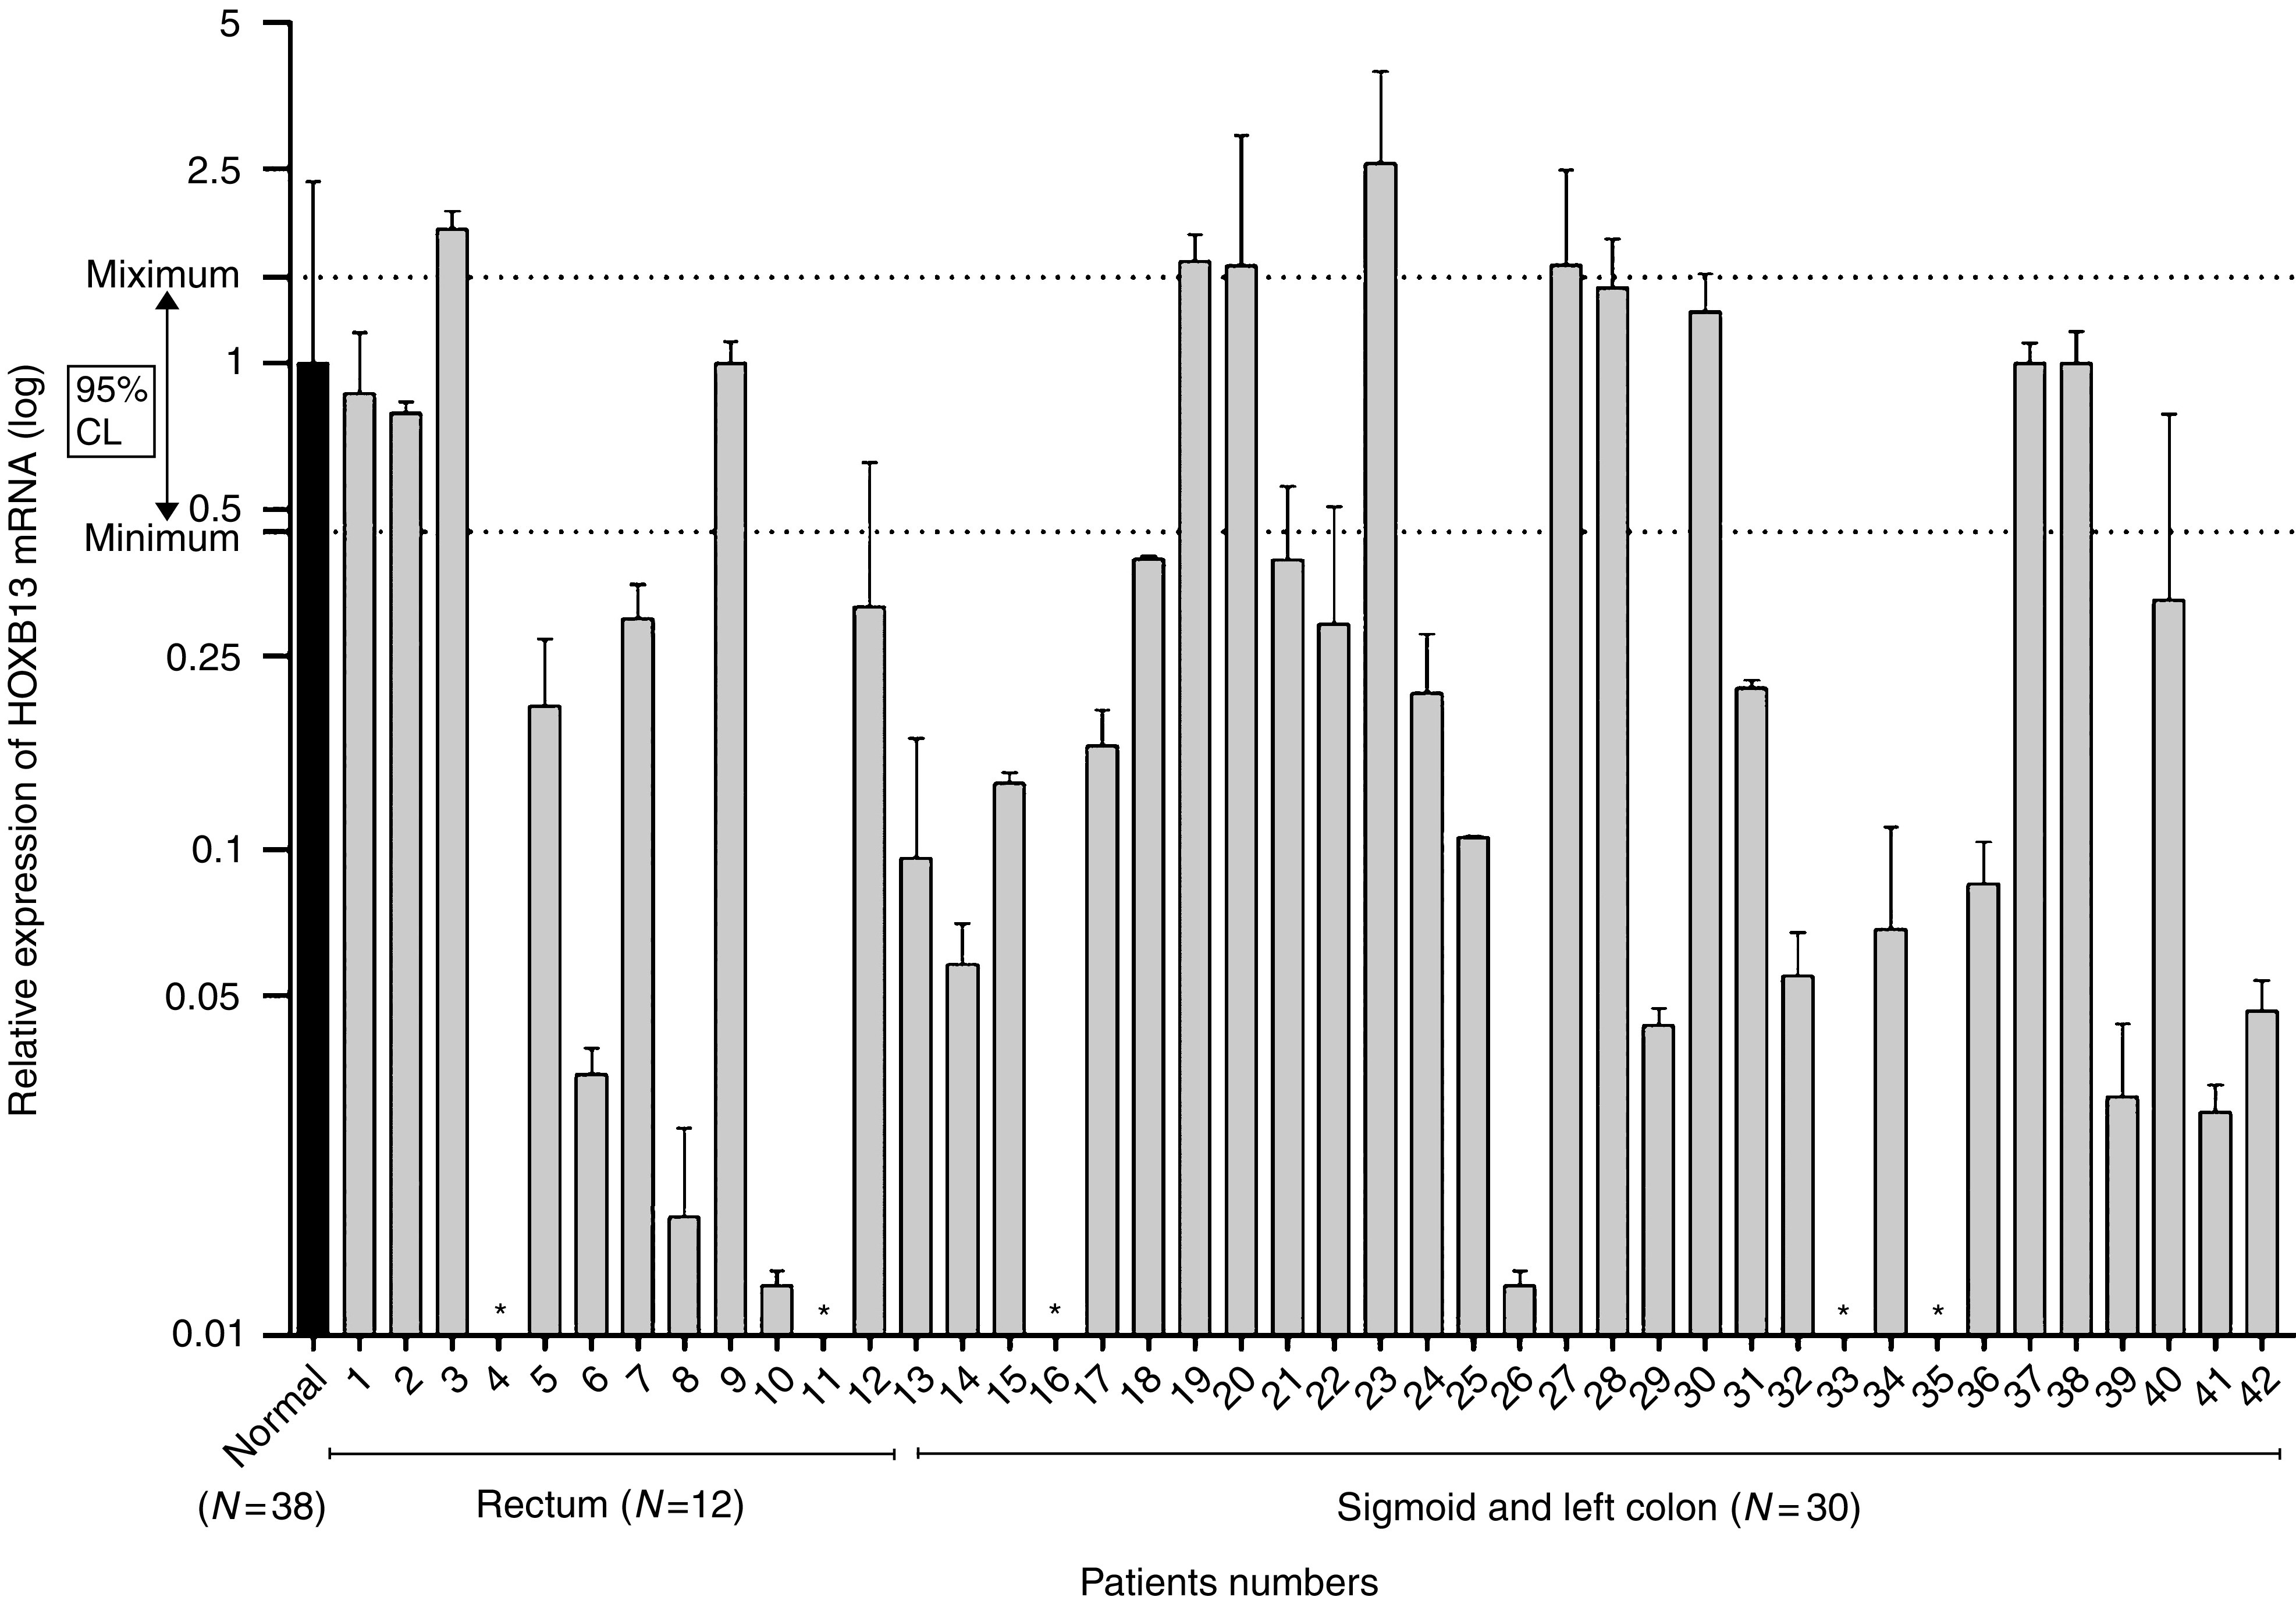
Figure 1.

Expression pattern of HOXB13 mRNA in colorectal tumours. Real-time RT–PCR was performed with RNA extracted from colorectal tumours and matching normal tissues. Levels of HOXB13 in both normal and tumour tissues were normalised by β-actin. Relative expression of HOXB13 in normal tissues were averaged (black bar), which was used for comparative HOXB13 expression in each tumours. Dotted line represents 95% confidence interval for the range of HOXB13 expression in normal colorectum. *HOXB13 not detectable in tumours. Note X-axis is a log scale.
