Figure 1.
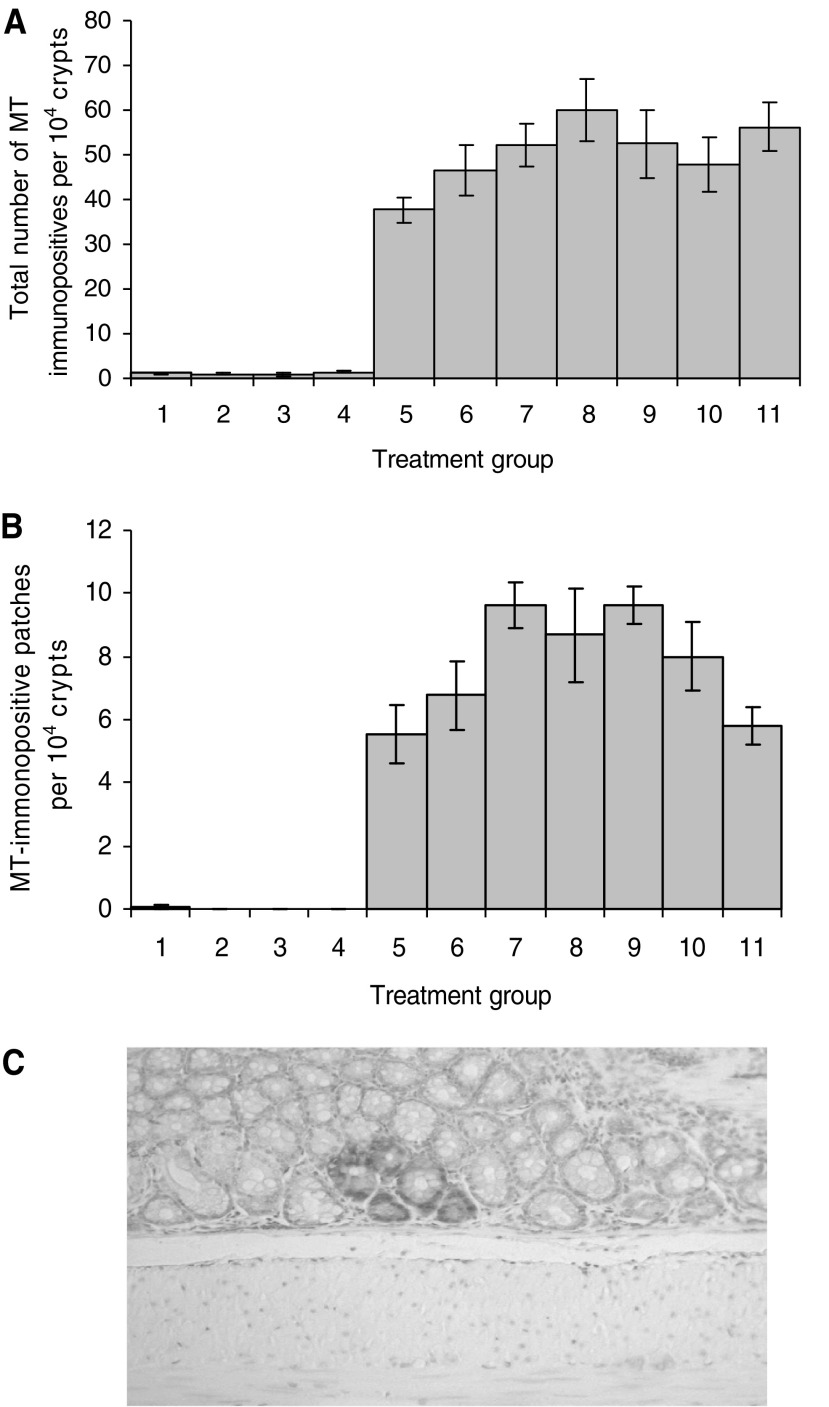
Treatment effects upon MTCRII. (A) Total MT-immunopositive crypt number per 104 crypts in each treatment group. Significant between-group treatment differences were observed (P<0.01). The Duncan post hoc test identified three distinct homogeneous treatment subsets (A–C), showing significant incremental differences in total mutation load: (A) Groups 1–4, distilled water, DMSO or λCgN only (1 and 4%); (B) Groups 5 and 6, MNU only or MNU and one 7 day cycle of 1% λCgN; (C) Groups 8 and 11, MNU and three 7 day cycles of 1% λCgN or MNU and continuous 4% λCgN. Groups 7, 9 and 10 overlapped subsets B and C. (B) Formation of patches of ⩾2 contiguous MT immunopositive crypts in each treatment group. The Duncan posthoc test identified three distinct homogeneous treatment subsets (A–C), showing significant incremental differences in mutant (MT immunopositive) patch formation: (A) Groups 1–4, Distilled water, DMSO or λCgN only (1 and 4%); (B) Group 5, MNU alone; (C) Groups 7 and 9, MNU and one or three 7 day cycles of 4% λCgN. Groups 6, 8, 10 and 11 overlapped subsets B and C. (C) Large MT immunopositive patch. An example of a large patch comprising 5 MT immunopositive crypts, from a combined λCgN/MNU treatment group.

