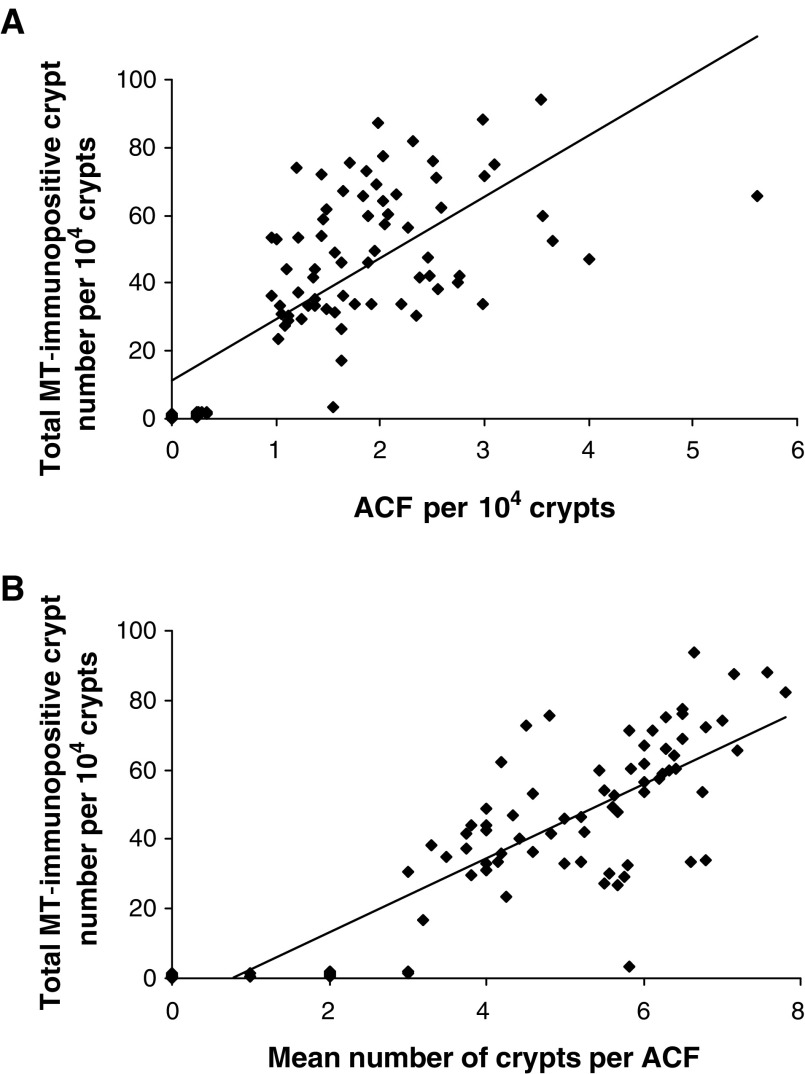
Figure 3.
Correlations between MTCRII and ACF. (A) Total MT-immunopositive crypt number vs number of ACF per 104 crypts. Correlation between total MT-immunopositive crypt number and ACF per 104 crypts in all treatment groups (r=0.732; P<0.01 by Pearson's product moment test). (B) Total MT-immunopositive crypt number vs size of ACF. Correlation between total MT-immunopositive crypt number per 104 crypts and ACF size in all treatment groups (r=0.84; P<0.01 by Pearson's product moment test).

