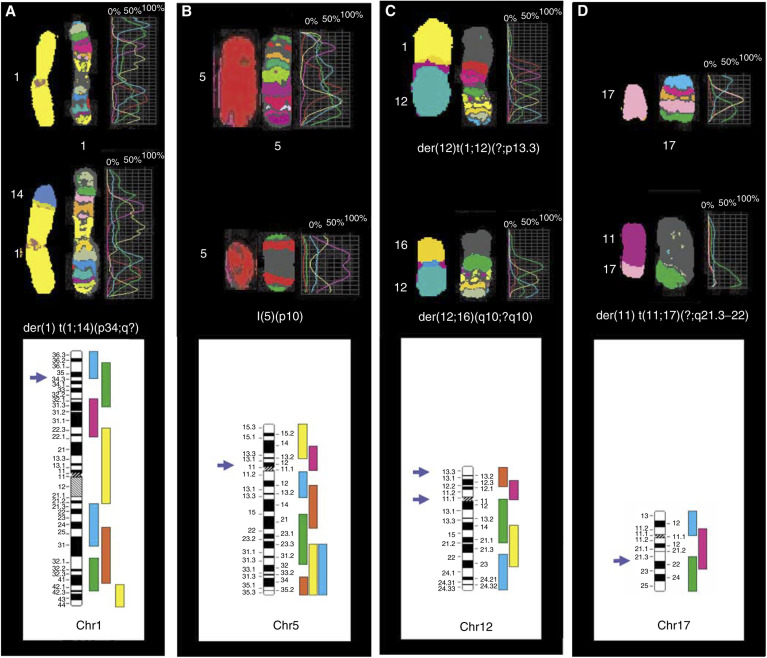
Figure 1.
Examples of mbanding-FISH in breast tumour cell lines. MDA-MB-231 (A), MDA-MB-157 (B and C) and ZR-75-1 (D) were analysed by FISH with specific mband cocktail probes for chromosome 1 (A), 5 (B), 12 (C) and 17 (D), respectively. M-FISH images of normal (save for chromosome 12 in MDA-MB-157 (C)), and derivative chromosomes 1, 5, 12 and 17 previously characterised in these cell lines (Popovici et al, 2002) are shown on the left hand of the corresponding mband images (pseudocolour profile) defined by colour spectra (on the right). Regional locations of breakpoints targeting der(1)t(1;14)(p34;q?) (A), I(5)(p10) (B), der(12)t(1;12)(?;p13.3) (C upper part), der(12;16)(q10;?q10) (C middle part) and der(11)(t(11;17)(?;q21.3–22) (D) present in MDA-MB-231 (A), MDA-MB-157 (B and C) and ZR-75-1 (D), respectively, were assigned by comparison with the normal profile. They are indicated by arrowheads on the corresponding ideograms (bottom part), which exhibit on their right hand the sequence of microdissected region-specific PCP labelled using a unique fluorochrome combination defining then the normal colour spectrum. Each PCP was labelled and partly overlaps with the neighbouring one.

