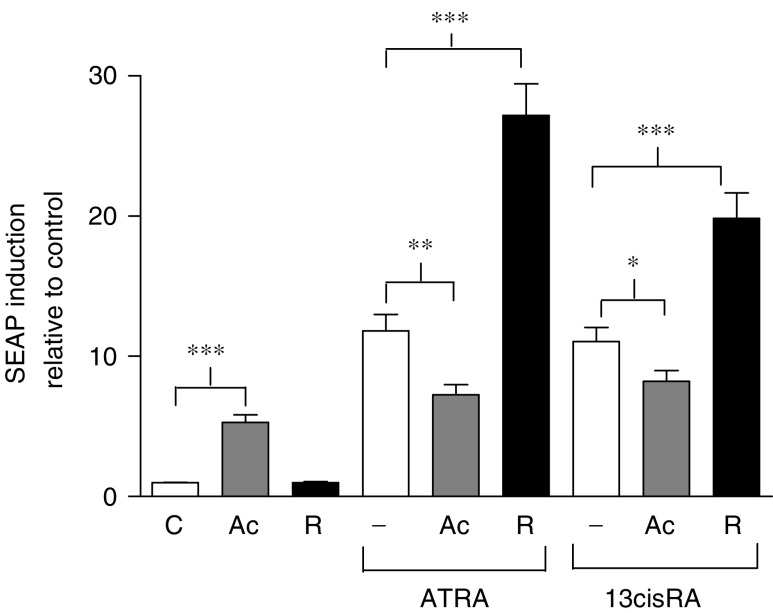
Figure 4.
Induction of SEAP expression. SH-SY5Y cells were incubated with ATRA or 13cisRA (0.1 μM) for 48 h in the absence or presence of acitretin (Ac, 1 μM) or R116010 (R, 1 μM). Values are expressed as fold increase relative to expression in untreated control cells. Data are mean values±s.e.m. from at least three independent experiments. Statistical significance from hypothesis tests in ANOVA is indicated by *** for P<0.001, ** for P<0.01 and * for P<0.05.

