Figure 5.
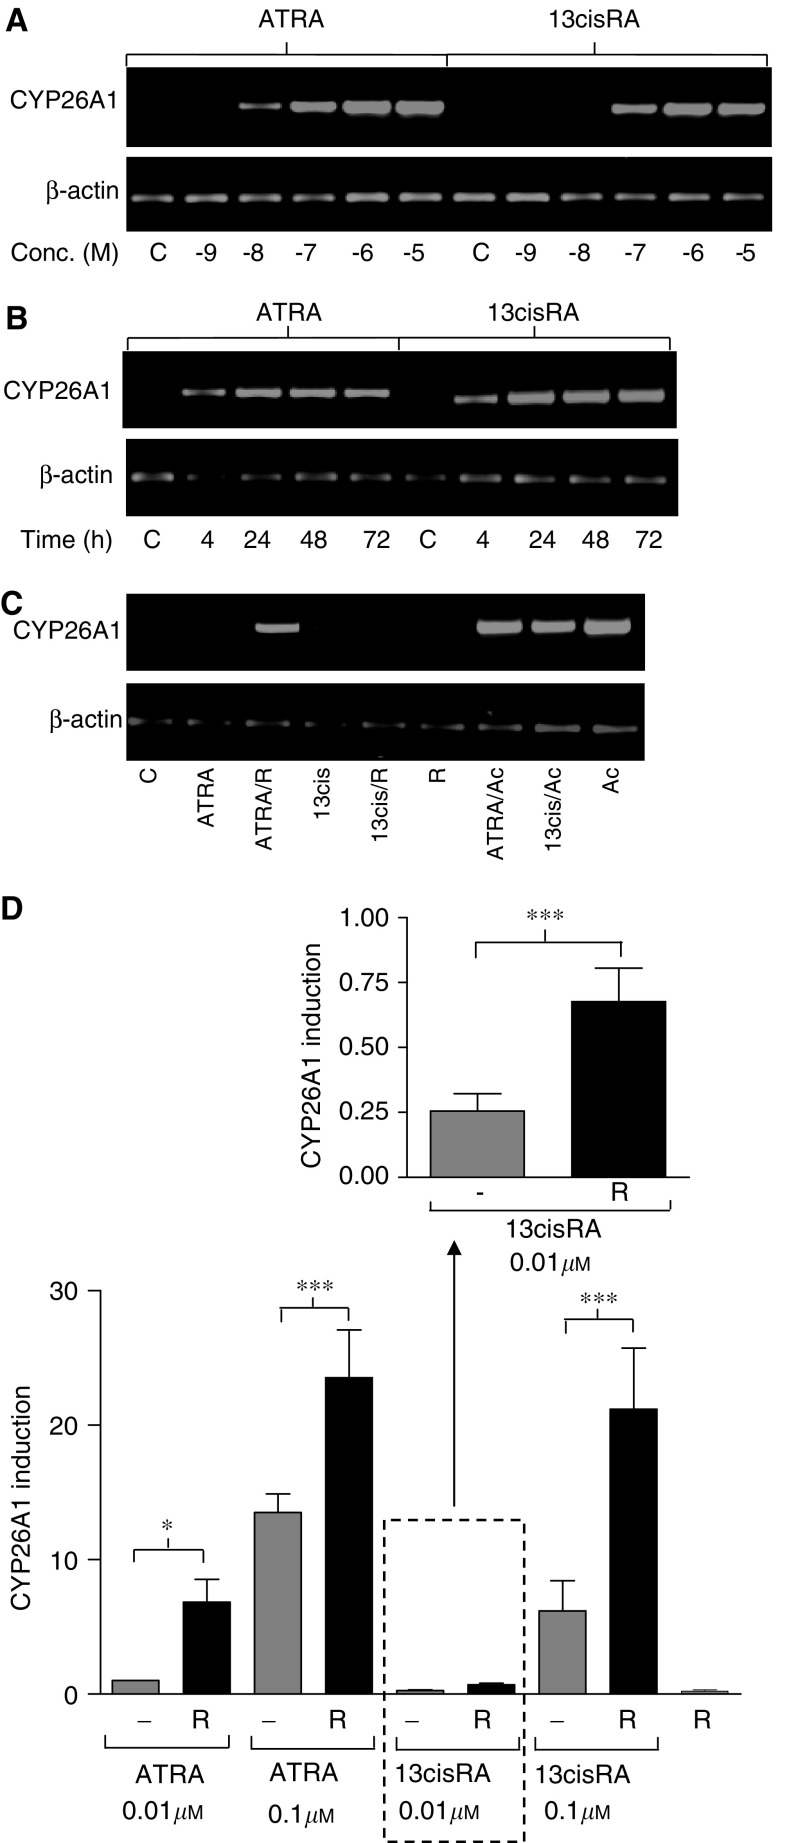
Induction of CYP26A1 mRNA expression determined by RT–PCR and real-time PCR. SH-SY5Y cells were treated with ATRA or 13cisRA for 24 h at the concentrations indicated (A) or with a fixed concentration of 1 μM ATRA or 13cisRA for up to 72 h (B). SH-SY5Y cells were treated with ATRA or 13cisRA (0.01 μM) for 24 h in the absence or presence of acitretin (Ac, 1 μM) or R116010 (R, 1 μM) (C). β-actin mRNA expression was used to normalise the reverse transcription reaction. Amplified products were analysed by agarose gel electrophoresis with ethidium bromide staining. Reverse-transcribed RNA from SH-SY5Y cells treated with ATRA or 13cisRA (0.01 or 0.1 μM) for 24 h in the absence or presence R116010 (R, 1 μM) was subjected to real-time PCR using TaqMan probes for CYP26A1 and β-actin (D). Values are normalised for β-actin levels and expressed as fold increase relative to expression of CYP26A1 in cells treated with 0.01 μM ATRA. Data are mean values±s.e.m. from at least three independent experiments. Statistical significance from hypothesis tests in ANOVA is indicated by * where F1,32=5.714, P<0.05, and *** where F1,32=15.496, P<0.001.

