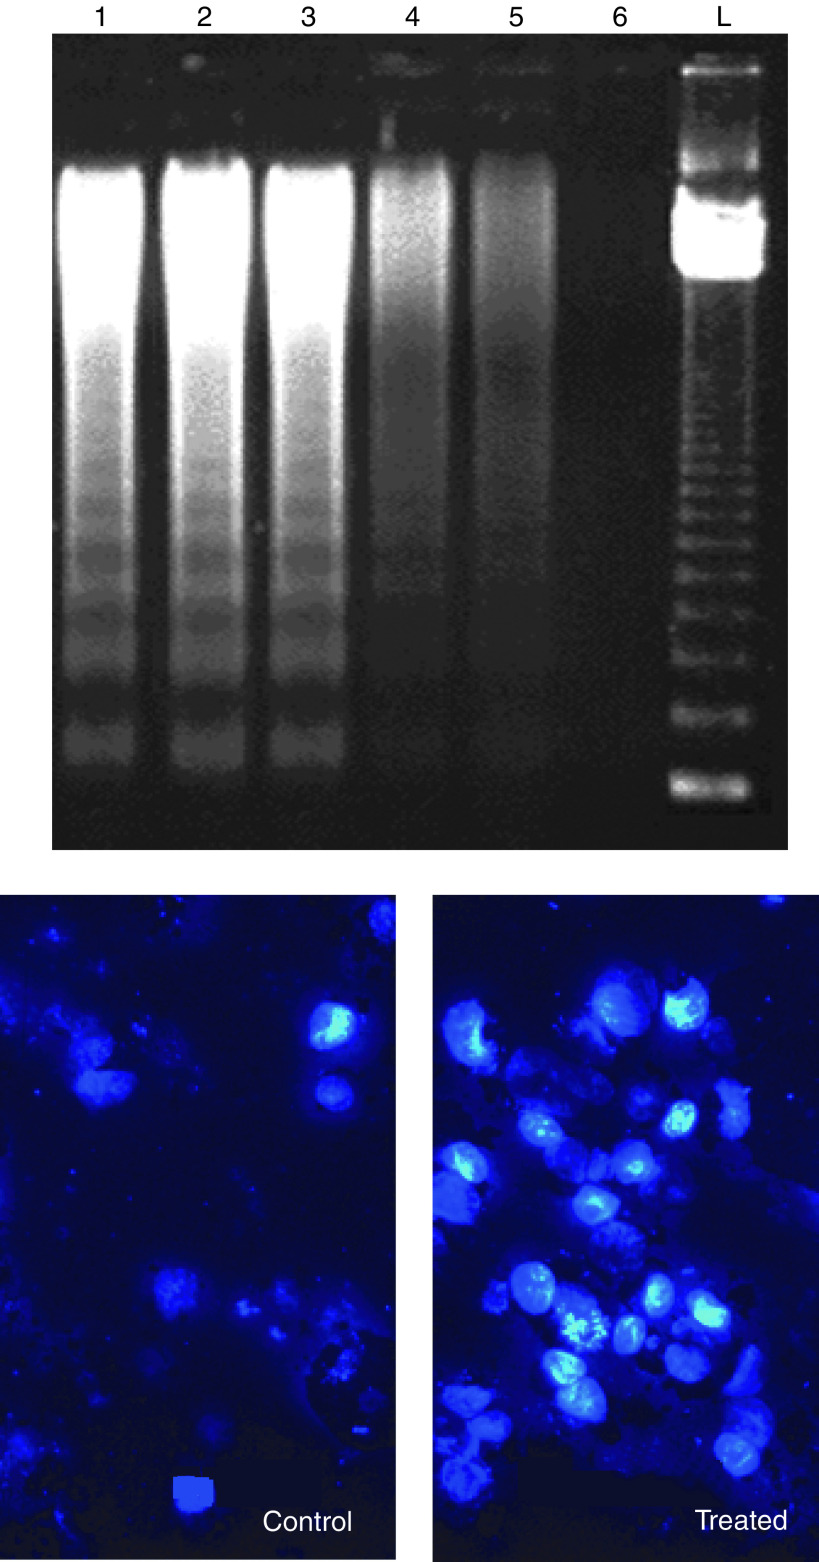
Figure 4.
DNA fragmentation in A549 cells after treatment with gemcitabine (lane 4), gemcitabine and topotecan simultaneously (lane 1), topotecan followed by gemcitabine (lane 2), gemcitabine followed by topotecan (lane 3) and topotecan (lane 5) (above). The simultaneous combination of topotecan and gemcitabine at the 6 : 1 fixed concentration ratio determined the highest increase in apoptosis vs control (lane 6). L, 180 DNA ladder for fragment size identification. Nuclear staining of A549 cells exposed to gemcitabine–topotecan simultaneously. The typical apoptotic morphology includes nuclear condensation, cell shrinkage and formation of apoptotic bodies as compared to control cells (below).

