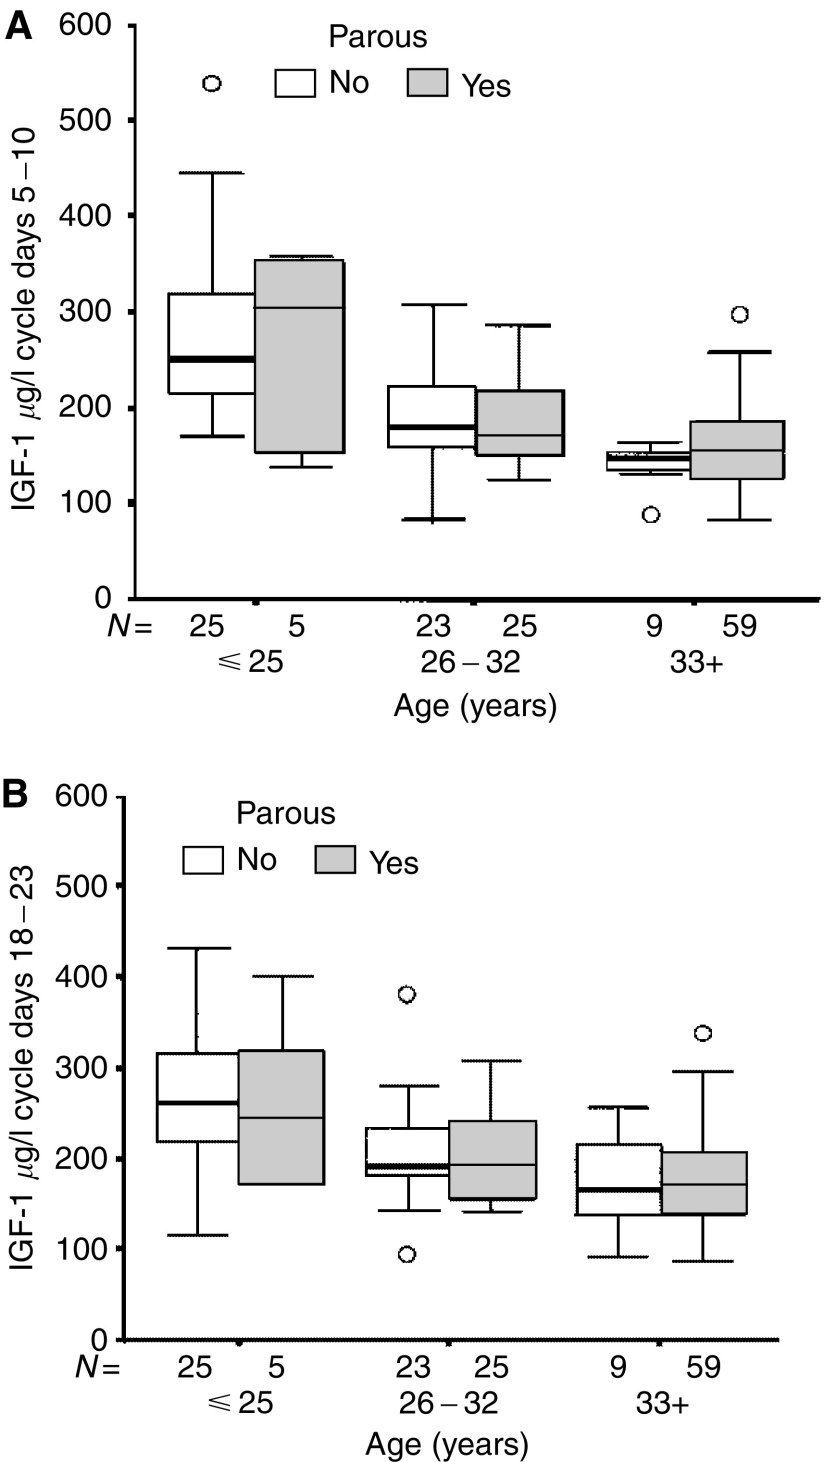
Figure 2.
(A, B) show that there were no significant differences in median IGF-1 levels between parous and nulliparous women not currently using any hormonal contraception in the samples obtained during cycle days 5–10 (P=0.57) or in the samples obtained during cycle days 18–23, that is, 5–10 days prior to the predicted onset of the next menstrual period (P=0.49). The horizontal line in the box indicates the median value, the box boundaries the 25th and 75th percentiles, and the capped bars the 10th and the 90th percentiles. The number of women in each group is indicated. Circles indicate outliers with values between 1.5 and 3 box lengths from the upper or lower edge of the box. Asterisks indicate extreme outliers with values more than 3 box lengths from the upper or lower edge of the box. The box length is the interquartile range.

