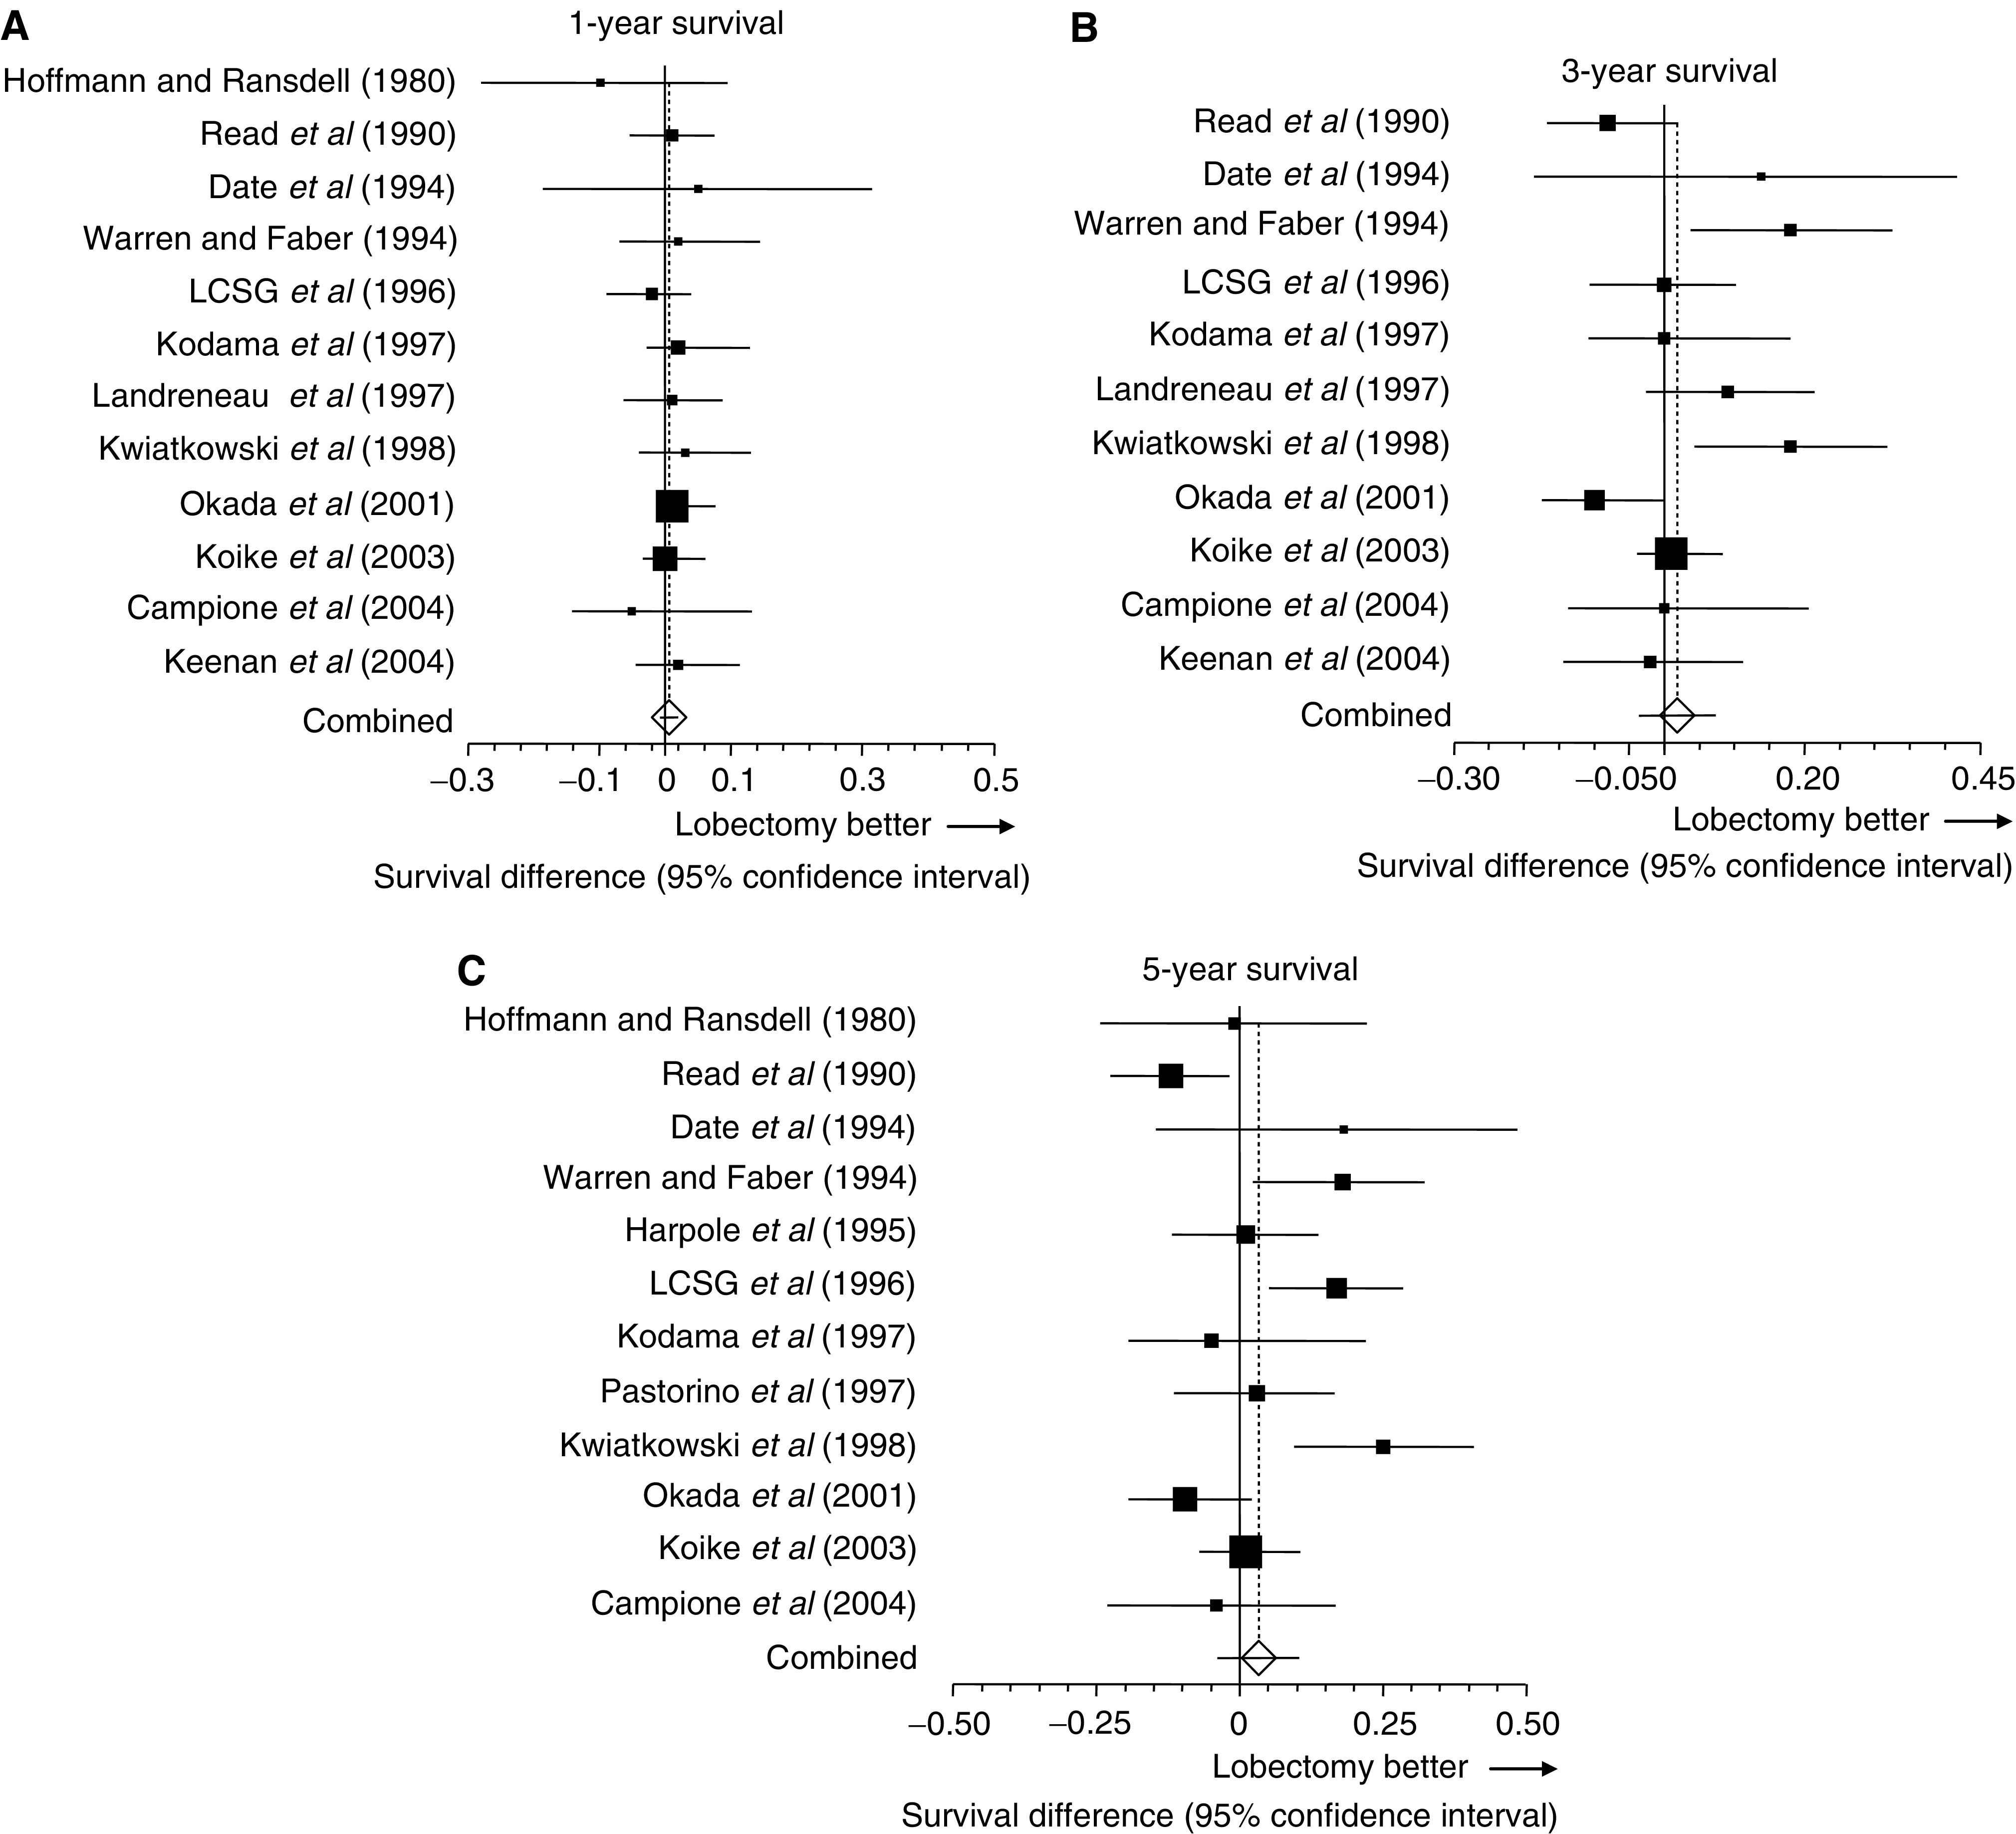
Figure 2.

Meta-analysis of survival differences between limited resection and lobectomy. Bars, 95% CI of survival rates in patients with lobectomy minus those in patients with limited resection. Areas of squares are proportional to weights used for combining data. The centre of the lozenge gives the combined survival difference. The survival difference was considered statistically significant if the 95% CI for the overall survival difference did not overlap zero. (A) The combined survival difference at 1 year was 0.7% (95% CI, −0.8 to 2.1; P=0.3659). The 1-year survival rate was not available in studies by Harpole (1995) and Pastorino (1997). (B) The combined survival difference at 3 years was 1.9% (95% CI, −3.7 to 7.4; P=0.5088). The 3-year survival rate was not available in studies by Hoffmann (1980), Harpole (1995), and Pastorino (1997). (C) The combined survival difference at 5 years was 3.6% (95% CI, −0.4 to 10.5; P=0.3603). The 5-year survival rate was not available in studies by Landreneau (1997) and Keenan (2004). Q-statistics and P-value for the heterogeneity test at 1, 3, and 5 years were as follows: (Q=4.6, P=0.9471; Q=27.0, P=0.0026; and Q=33.6, P=0.0004).
