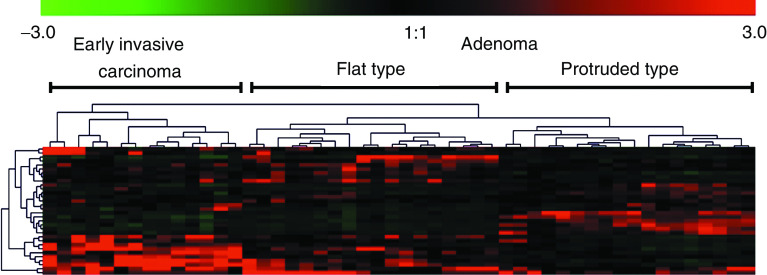
Figure 2.
A two-dimensional hierarchical clustering of 32 genes across 50 colorectal tumours. The colour in each well represents relative expression of each gene (vertical axis) in each paired sample (horizontal axis); red, increased in tumour tissues; green, decreased in the tumour tissues. In the sample axis, early invasive carcinomas and adenomas were separated into two different trunks. In the gene axis, 32 genes were clustered in different branches according to their similarity; the shorter the branches, the greater the similarity. In adenomas, subclusters of flat type and protruded type were selected for further analysis (see Figure 3).

