
Figure 2.
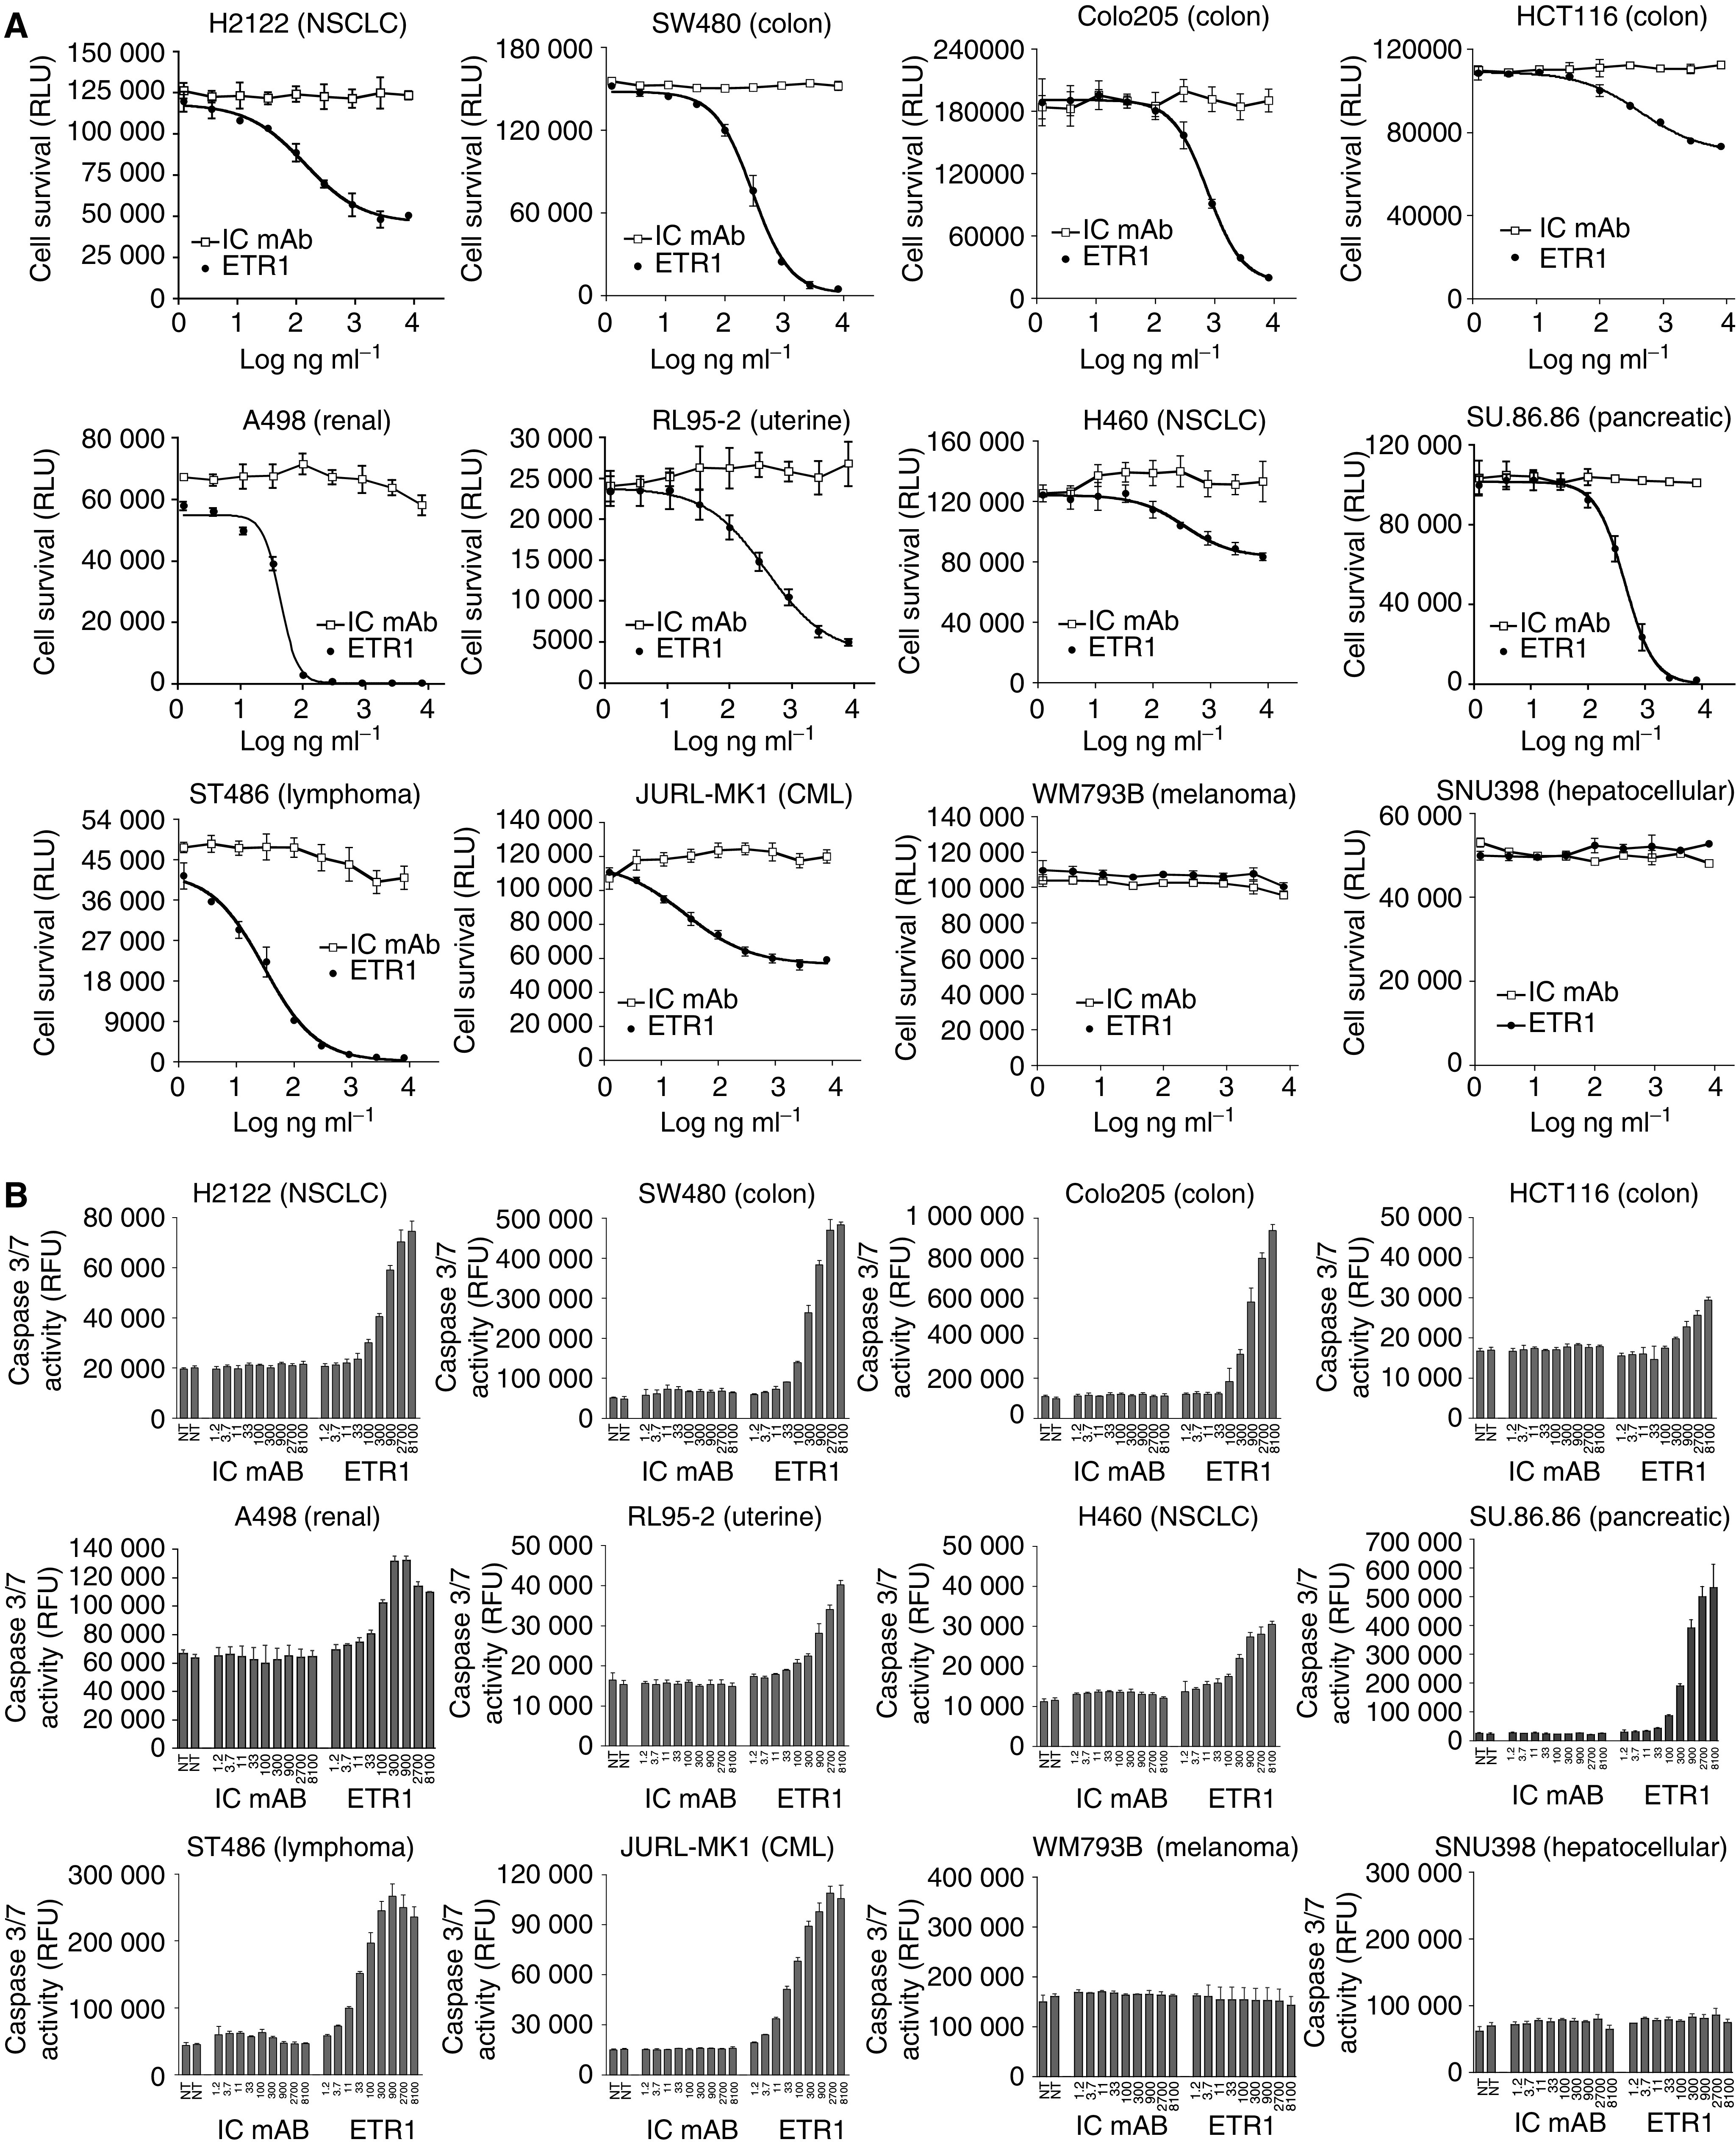

HGS-ETR1 induces tumour cell killing and apoptotic signalling. (A) SW480, Colo205, HCT116, H2122, H460, SU.86.86. RL95-2, ST486, JURL-MK1, A498, SNU398, and WM793B cells were plated in 96-well plates at approximately 1 × 10⁴ cells well−1, and cultured overnight. Indicated concentrations of HGS-ETR1 (closed circles), or isotype control antibody (IC mAb, open squares) were added and cell viability, measured as relative light units (RLU), was determined after 48 h. (B) Cells were treated as in viability assays (ng ml−1) and caspase 3/7 activity was measured as relative fluorescent units (RFU) after 6 h of treatment. The viability and caspase data are the mean±s.d. of triplicate samples from matching representative experiments. (C) ST486, SW480, and HCT116 cells were plated on 100-mm plates, cultured overnight and indicated concentrations of HGS-ETR1 or isotype control antibody (10 μg ml−1) were added. After 4 h of treatment, cell lysates were prepared, normalised for protein concentration and Western analysis was performed. The actin protein levels are shown as a control for protein loading.