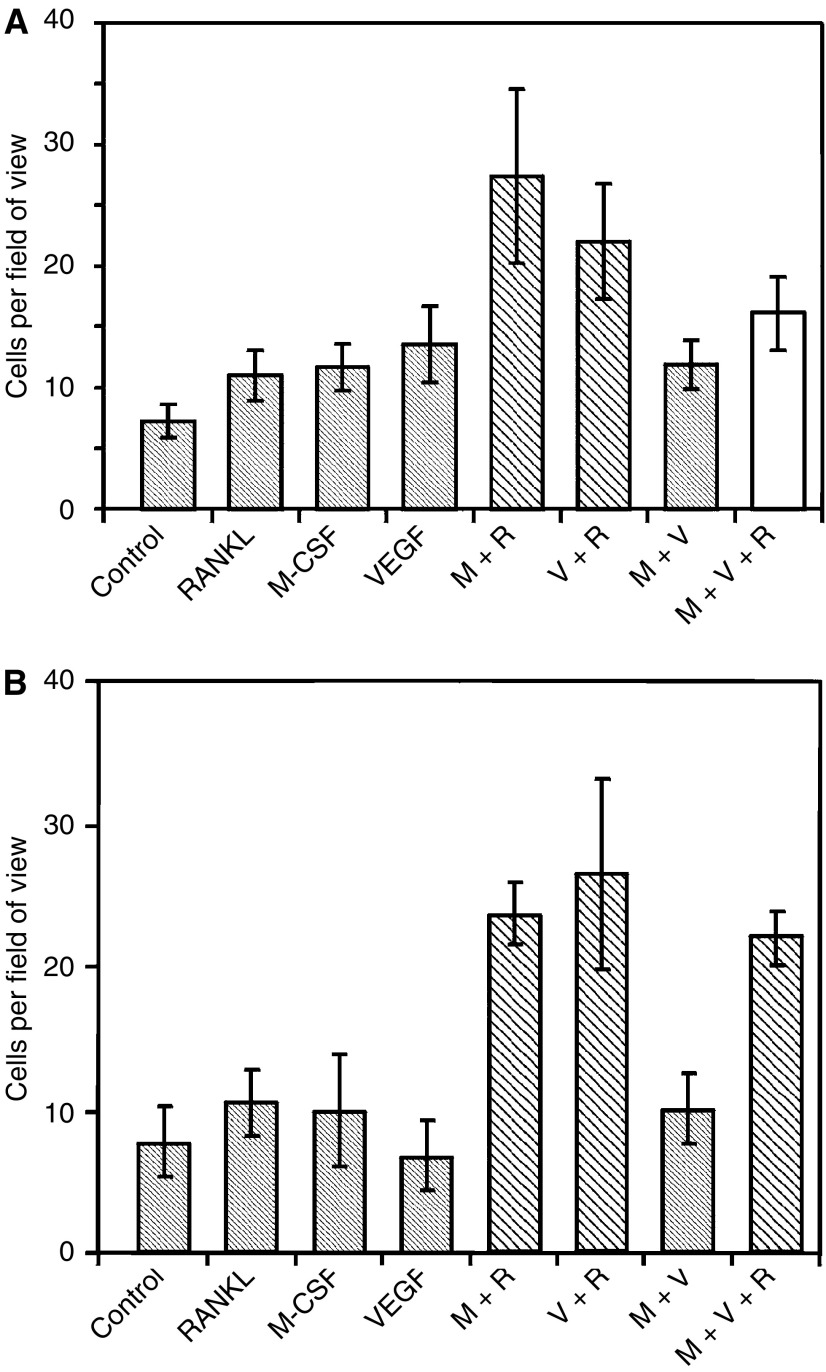
Figure 3.
Graph showing mean numbers of multinucleated TRAP-positive cells after stimulation with cytokines (M=M-CSF, R=RANKL, V=VEGF). The experiments were carried out in both (A) PBMCs and (B) RAW 264.7 cells. The experiments were repeated in triplicate and typical graphs are shown here. Bars in stripes are significantly different on ANOVA at 95% CI from negative control. Grey bars are significantly different from positive control (M+R). White bars are different from both.

