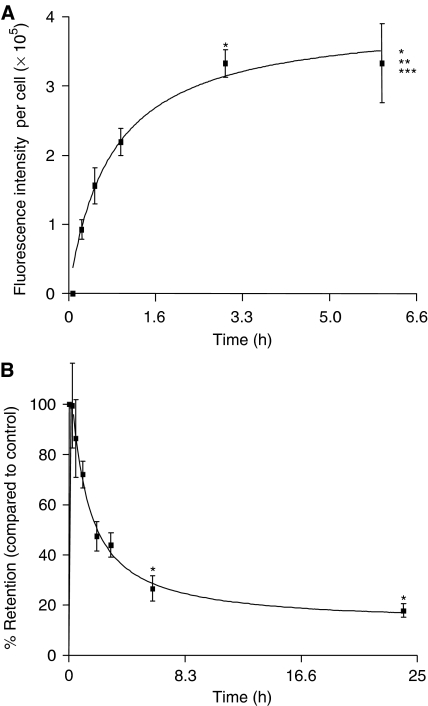
Figure 2.
Cellular uptake, clearance and subcellular localisation of ADPM01 in HeLa cells. Cellular uptake (A) and clearance (B) of ADPM01 in HeLa cells over 6 and 24 h periods, respectively. Each data point represents the mean fluorescent intensity per cell in five fields of view (minimum of 30 cells per field of view, × 20 magnification). Graphs illustrate the average of three independent experiments. Statistics for (A), ANOVA: P<0.0001, F=10.72, Bonferroni multiple comparison test: *P<0.01, compared to 15 min time point; **P<0.05, compared to 30 min time point; ***P<0.05, compared to 1 h time point. Statistics for (B), ANOVA: P=0.0017, F=5.46. Bonferroni multiple comparison test: *P<0.05, compared to control, that is, immediately after removal of the drug.

