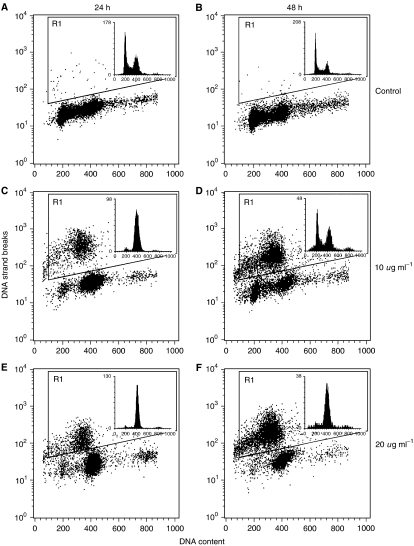
Figure 1.
The histograms for DNA fragmentation show biotin-dUTP content as a measure of DNA strand breaks (ordinate) vs DNA content (abscissa) and cells undergoing apoptosis are enclosed in window R1. The histograms for DNA distribution (upper right corner) show DNA content (abscissa) against number of cells (ordinate). The data are from untreated cells after 24 h (A) and 48 h (B), cells treated with 10 μg ml−1 thiosulphonates for 24 h (C) and 48 h (D) and cells treated with 20 μg ml−1 thiosulphonates for 24 h (E) and 48 h (F).

