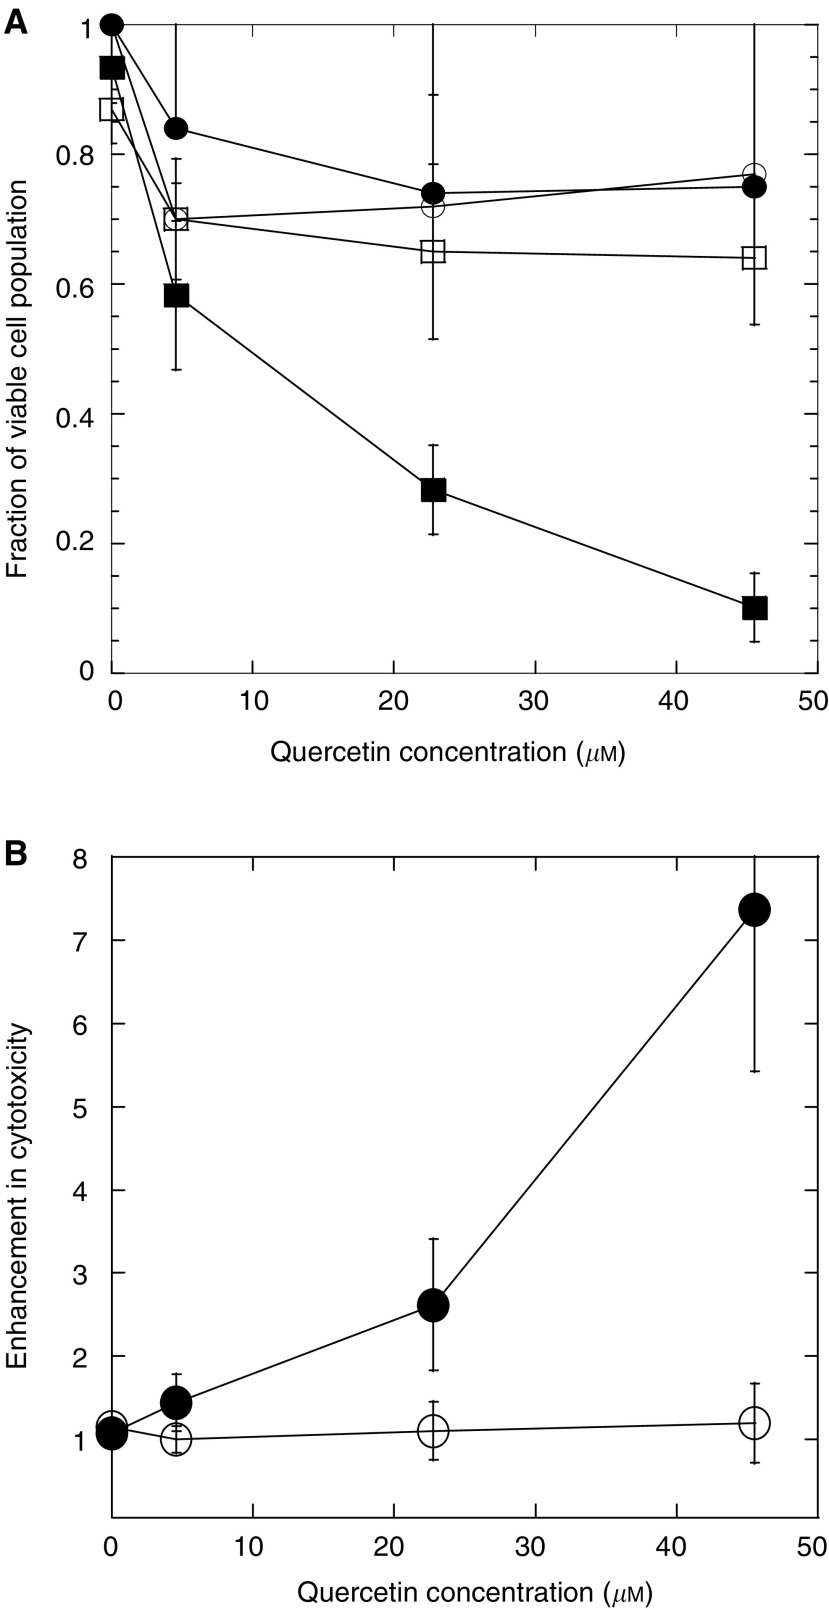
Figure 1.
(A) Fractional loss of viable skin cancer cells (closed squares) and skin normal cells (open squares) when exposed to various concentrations of quercetin after a short exposure to ultrasound (20 kHz, 2 W cm−2, 60 s). P<0.25 for 5 μM quercetin concentration; and P<0.001 for 25 and 50 μM quercetin concentration. The figure also shows fractional loss of viable skin cancer cells (closed circles) and skin normal cells (open circles) when exposed to various concentrations of quercetin without ultrasound exposure. P>0.35 for 5 μM quercetin concentration, and P>0.90 for 25 and 50 μM quercetin concentration. Error bars indicate standard deviation. For skin cancer cells exposed to quercetin alone, error bars are shown only on one side for visual clarity. (B) Enhancement of cytotoxicity due to ultrasound application in skin cancer (closed circles) and skin normal cells (open circles) after incubation with quercetin at various concentrations. P<0.30 for 5 and 25 μM quercetin concentrations; P<0.02 for 50 μM quercetin concentration. Each point represents the average of three to five points. Error bars indicate standard deviation. Unpaired t-test for unequal variance was used to calculate probability values.

