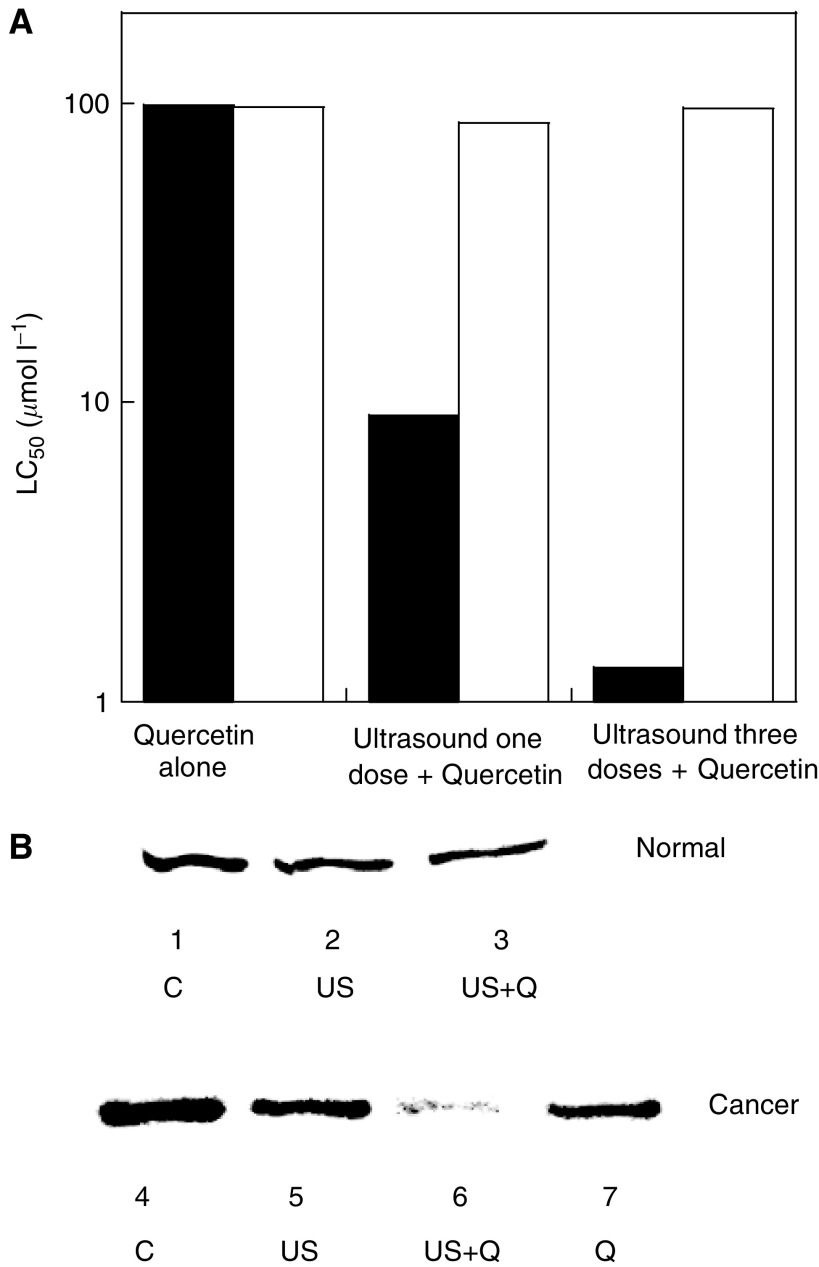
Figure 2.
(A) Reduction of LC50 for skin cancer cells (filled bar) and skin normal cells (open bars) due to application of ultrasound and quercetin. Quercetin alone has an LC50 of about 98 μM for skin cancer as well as skin normal cells. A single application of ultrasound (20 kHz, 2 W cm−2, 60 s) prior to incubation with quercetin substantially decreased LC50 for skin cancer cells to 9 μM, but only moderately affected LC50 for skin normal cells (86 μM). Application of three ultrasound pulses (prior to quercetin application, at 48 h and 72 h after the first application) further reduced LC50 for skin cancer cells to 1.2 μM. Application of two pulses had no significant effect on LC50 for skin normal cells. (B) Cellular concentrations of hsp72 in nonmalignant skin cells (first three lanes) and skin cancer cells (last four lanes). The first lane shows hsp72 concentration in nonmalignant skin cells prior to exposure to ultrasound or quercetin (control). The second lane shows hsp72 concentration in nonmalignant cells exposed to ultrasound alone. The third lane shows hsp72 concentration in nonmalignant skin cells exposed to ultrasound, followed by 50 μM quercetin for 48 h. The fourth lane shows control samples for skin cancer cells. hsp72 concentration in skin cancer cells is higher than that in skin normal cells. The fifth lane represents skin cancer cells exposed to ultrasound alone (20 kHz, 2 W cm−2, 60 s). The sixth lane shows hsp72 concentration in skin cancer cells exposed to ultrasound and subsequently to 50 μM quercetin for 48 h. The seventh lane represents cells exposed to 50 μM quercetin alone for 48 h.

