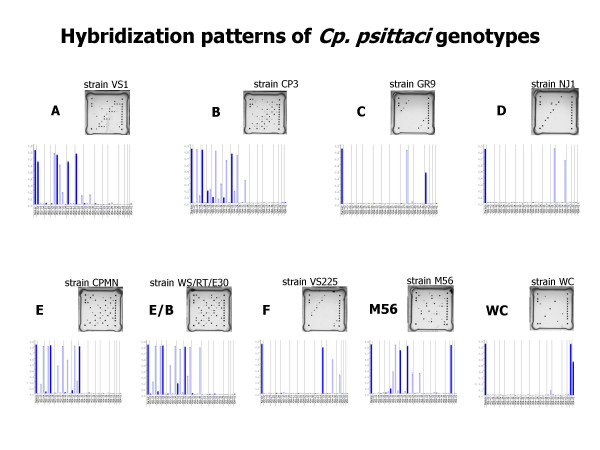
Figure 2.
Hybridization patterns presented as microarray images and barplot diagrams of nine strains representing C. psittaci genotypes A, B, C, D, E, E/B, and F, as well as strains M56 and WC. The leftmost bar in each plot represents the signal of the internal staining control (biotinylated oligonucleotide probe).

