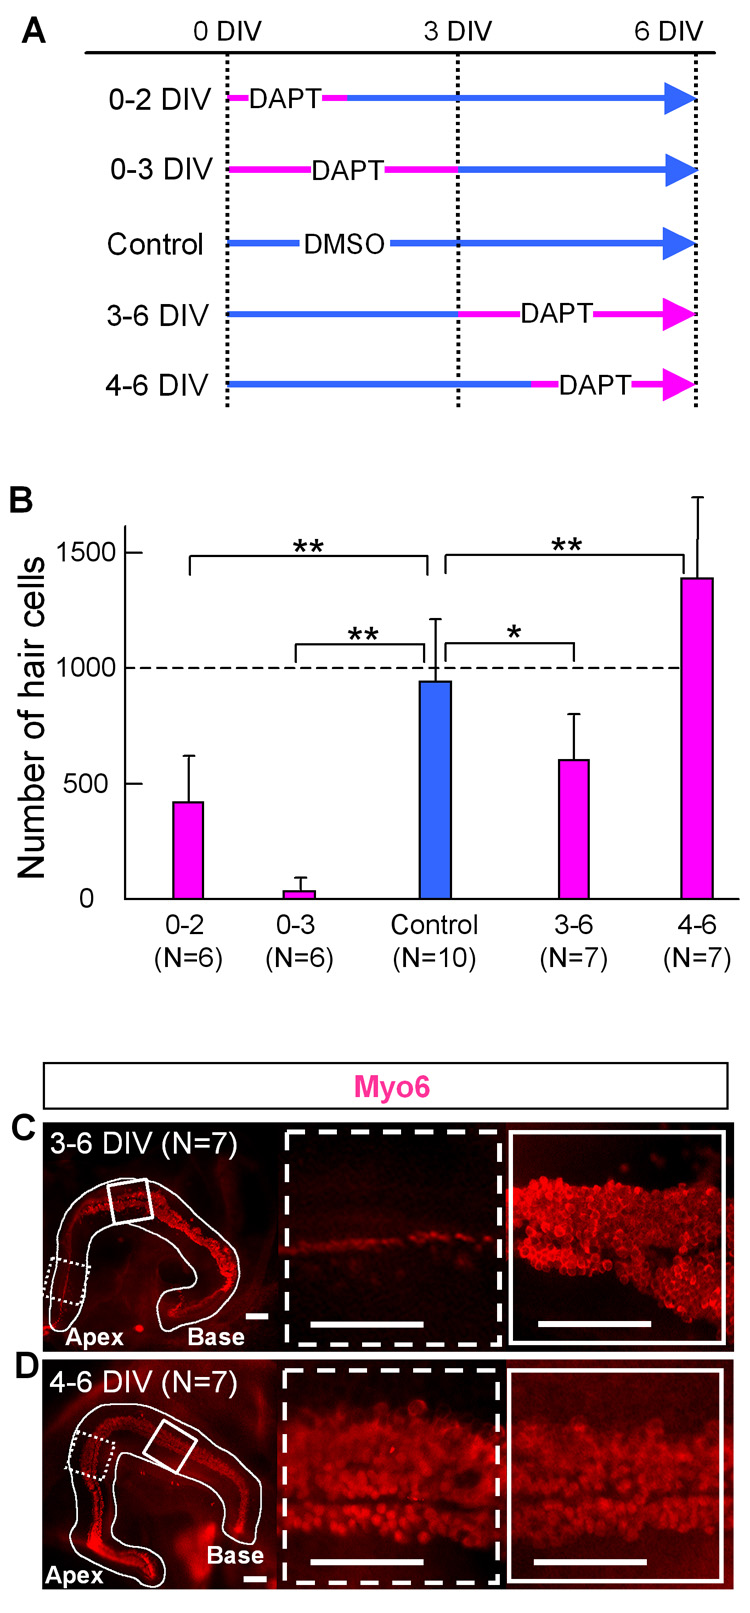
Fig. 9. Change in the number of hair cells that develop in the cochleae cultured with DAPT for different durations.

A: Experimental design of the DAPT treatment of cochlear culture. The cochleas were separated into control and 4 different treatment groups. DIV: days in vitro. B: Number of hair cells in a cochlea cultured for 6 days with or without DAPT according to the time schedule in A. Error bars indicate standard deviations of the means. N= number of cochleas. Asterisk indicates P< 0.05, double asterisk indicate P< 0.005 compared to the control with a Student's T-test. C, D: anti-Myo6 staining of cochlea in middle (C) or late (D) treatment group. The basal end of the ducts are to the right, the apex is to the left. White box shows the sensory epithelium from the basal send of the explant and dashed box shows the apical region. Scale bar= 100 µm.
