
Figure 2.
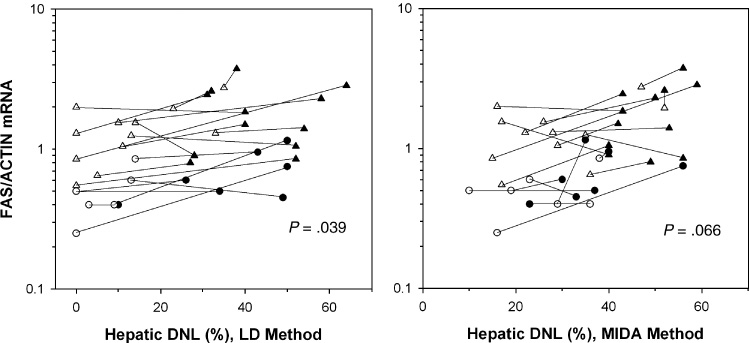
Mean values for FAS/Actin mRNA in abdominal and gluteal adipose tissue are plotted against hepatic DNL measured by LD (left panel) and MIDA (right panel). 12 lean, 7 obese subjects; black= high-sugar diet; white=low-sugar diet; lean=triangles, obese=circles. The responses to the 2 diets per subject are connected. For each plot, the positive relationship between the change in markers of DNL in adipose tissue and liver is of borderline statistical significance (sign test for continuous variables).