
Fig.
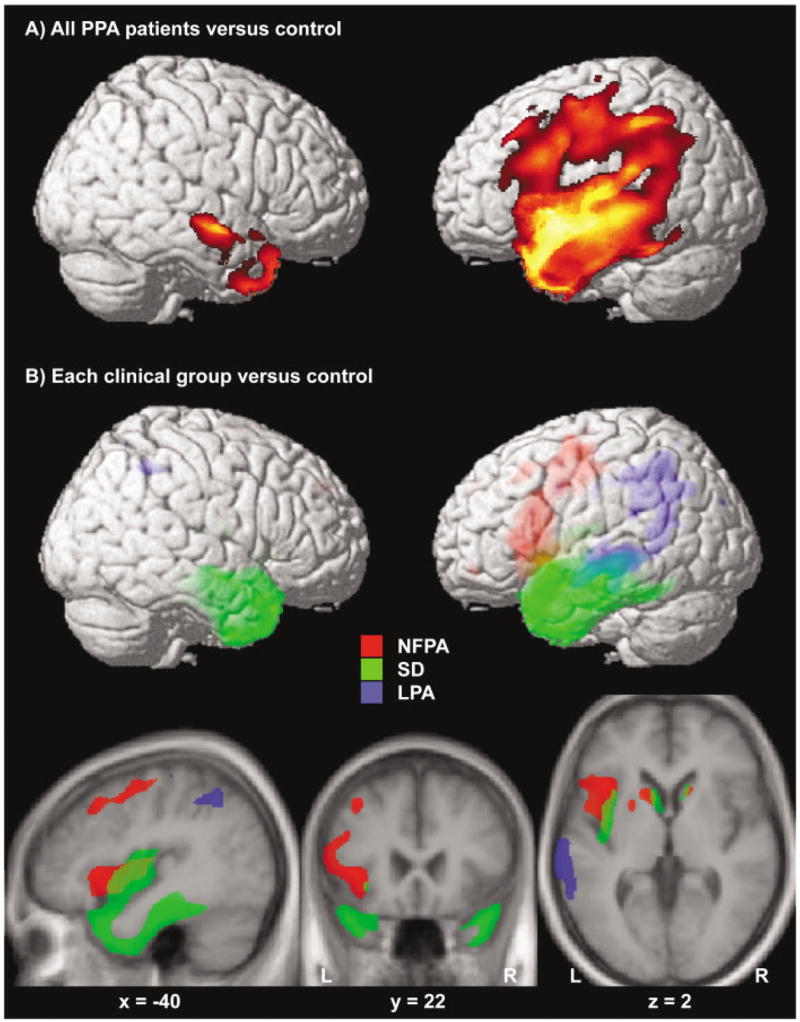
(A) Areas significantly atrophied in all primary progressive aphasia (PPA) patients versus controls. (B) Areas of significant atrophy in each clinical subgroup versus controls are indicated in three different colors (red for nonfluent progressive aphasia [NFPA], green for semantic dementia [SD], and blue for logopenic progressive aphasia [LPA]). All figures were obtained within SPM using a statistical threshold of p value less than 0.05 corrected for multiple comparisons for each contrast. Regions of significant gray matter loss were superimposed on a three-dimensional rendering of the Montreal Neurological Institute standard brain (A, B) and on axial, coronal, and sagittal sections of the mean image of the scans used to obtain the template image (B). The coordinates of the sections correspond to the peak of the left insular cluster in the contrast NFPA versus control. Color saturation in B indicates depth from the cortical surface (less saturated = deeper).