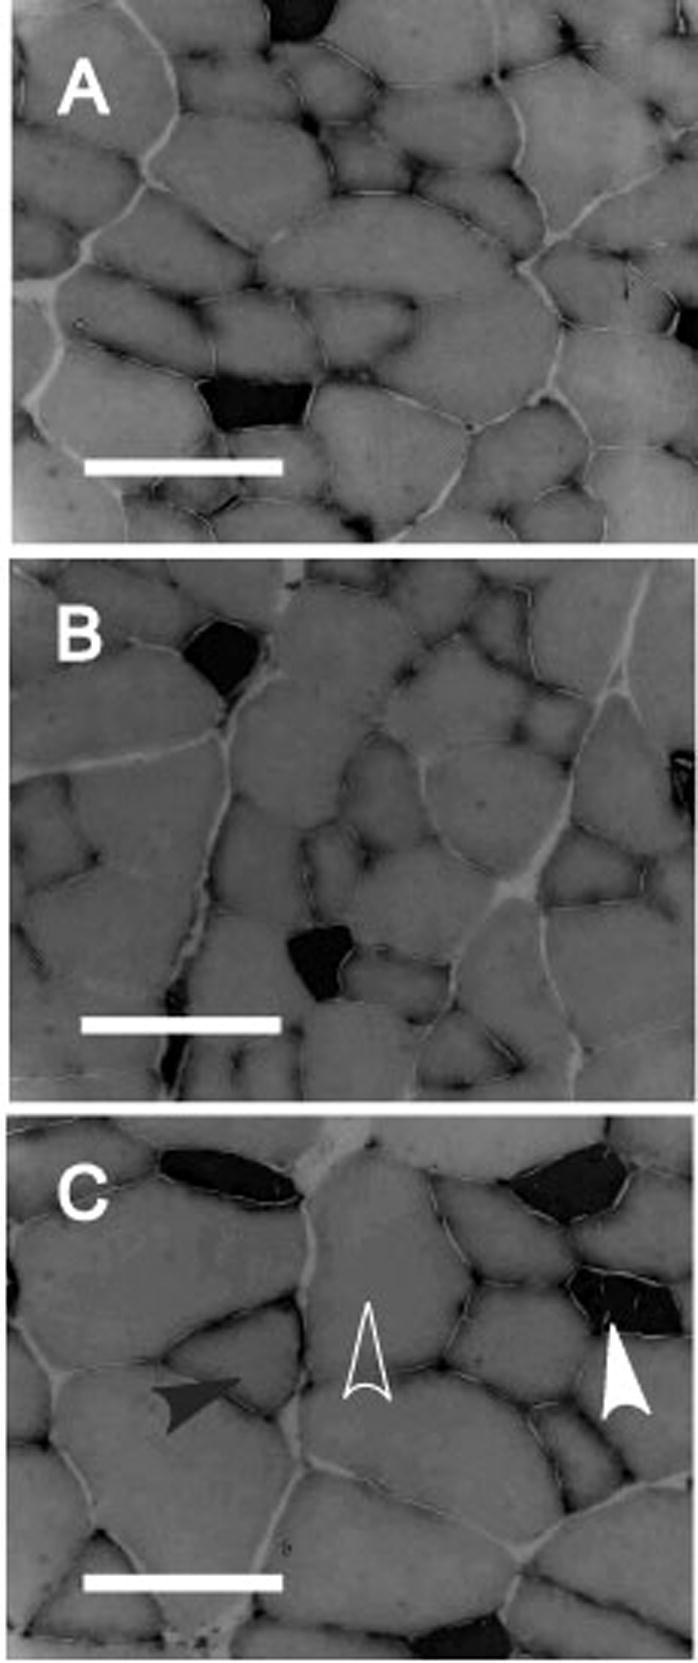
Figure 1.

Representative histomicrographs of EDL muscle cross sections for each group based on tendon length. Myosin ATPase stain at pH 4.5. A) Control Tendon Length muscle, B) Increased Tendon Length muscle, C) Decreased Tendon Length muscle. Solid white arrowhead denotes Type I fiber, white outline arrowhead denotes Type IIa fiber, and solid black arrowhead denotes Type IIb fiber. Data on fiber type percentage and cross-sectional area are presented in Table 3. Scale bar is 100 micrometers.
