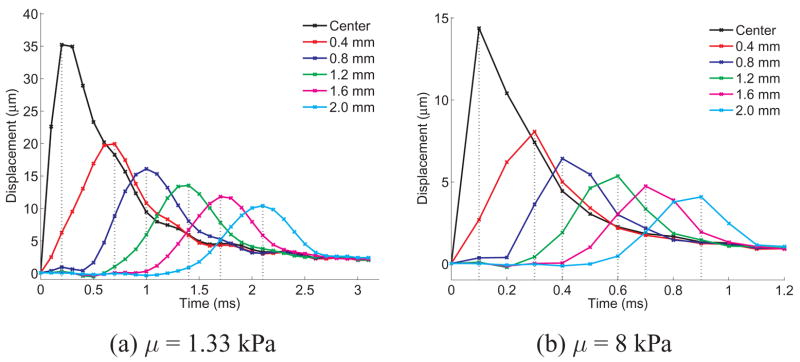
Figure 3.
Simulated displacement through time profiles, without ultrasonic tracking, at lateral positions offset from the excitation location for elastic media with shear moduli of (a) 1.33 kPa and (b) 8 kPa. Notice that the curve appears more finely sampled in the more compliant medium (1.33 kPa) due to its slower propagation speed and the fixed 10 kHz temporal sampling (simulating a fixed PRF in the experimental system). The vertical dotted lines indicate the TTP values that would be estimated from this data, though experimentally the data would be upsampled using a low-pass interpolation from the acquired PRF to 50 kHz. Notice that the two plots are on different time scales.

