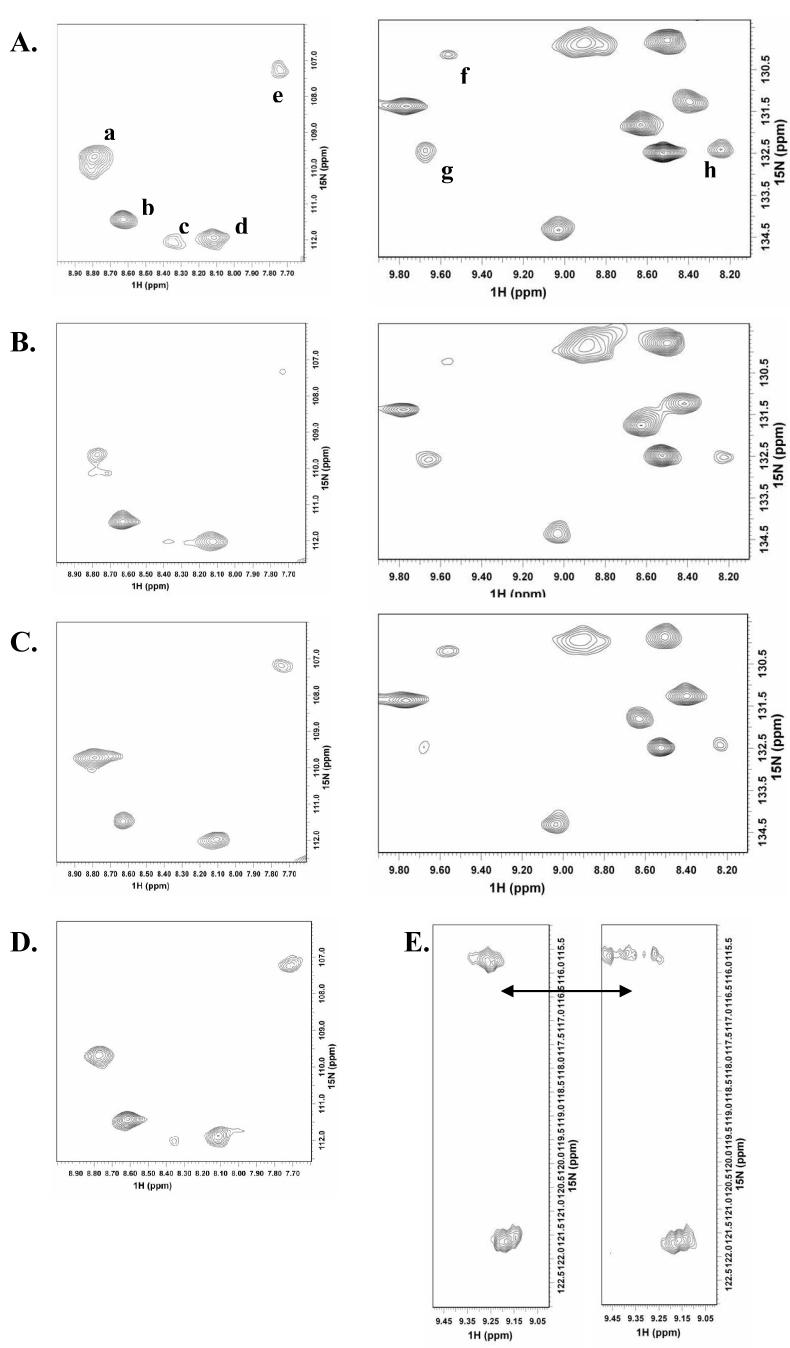
FIG. 3.
Comparison of changes upon endotoxin ligand addition for a representative set of resonances in the 600 MHz 15N,1H HSQC spectra of 15N labeled sCD14-EBD. (A) sCD14-EBD only, (B) sCD14-EBD in 1:1 complex with ReLPS, (C) sCD14-EBD in 1:1 complex with LTA and (D) sCD14-EBD in 1:10 complex with MDP. (E) Splitting of a representative resonance in sCD14-EBD (left sub-spectrum) into multiple peaks upon complexation with ReLPS (right sub-spectrum), indicating change in dynamics to slower exchange on the NMR time scale.

