
Figure 5.
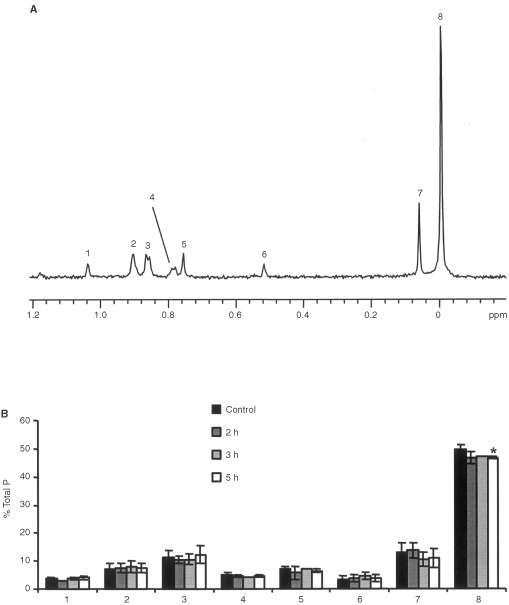
(A) 1H decoupled 31P MR spectrum of the lipid fractions of Jurkat T-cell extracts (1=cardiolipin, 2=plasmalogen phosphatidylethanolamine, 3=phosphatidylethanolamine, 4=phosphatidylserine, 5=sphingomyelin, 6=phosphatidylinisitol, 7=plasmalogen phosphatidylcholine, 8=phosphatidylcholine). Spectrum is the result of 1280 scans plotted with line broadening of 0.1 Hz. (B) Time course for the changes in phospholipid content of Jurkat T-cells showing the drop in phosphatidylcholine levels following Fas mAb treatment (100 ng ml−1) (* P<0.01).