
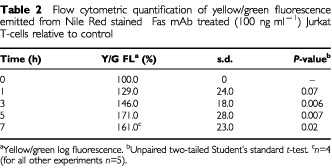
Table 2. Flow cytometric quantification of yellow/green fluorescence emitted from Nile Red stained Fas mAb treated (100 ng ml−1) Jurkat T-cells relative to control.
Official websites use .gov
A
.gov website belongs to an official
government organization in the United States.
Secure .gov websites use HTTPS
A lock (
) or https:// means you've safely
connected to the .gov website. Share sensitive
information only on official, secure websites.