Figure 1.

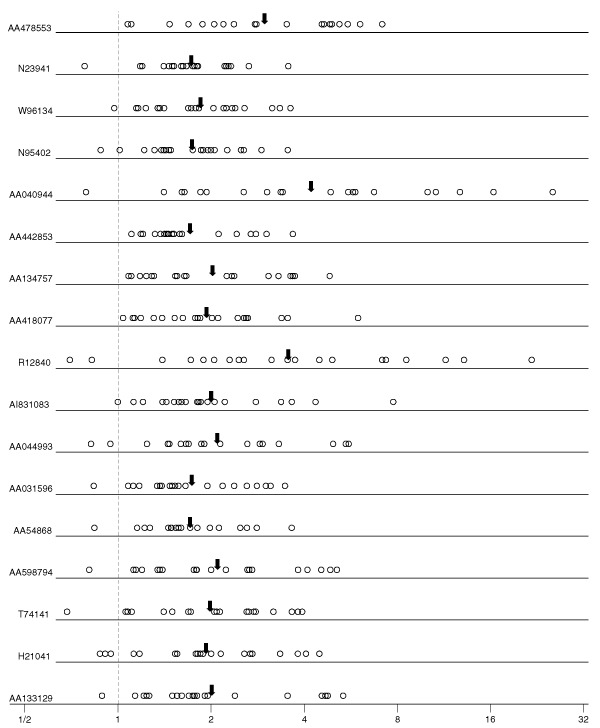
For each gene given in Table 1, plotted points are the ratios of the post-chemotherapy to pre-chemotherapy gene expression ratios for each of 18–20 patients, and arrows are the geometric means of the post/pre ratios.

For each gene given in Table 1, plotted points are the ratios of the post-chemotherapy to pre-chemotherapy gene expression ratios for each of 18–20 patients, and arrows are the geometric means of the post/pre ratios.