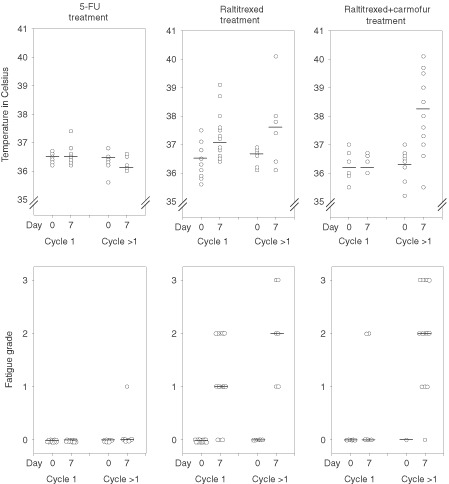
Figure 3.

Body temperature and the fatigue grade of 59 patients who participated in the cross-sectional study. The results are shown split by the type of treatment given and the chemotherapy cycle assessed (cycle 1, evaluation was carried out during the first chemotherapy cycle; cycle >1, evaluation was done during one of the later cycles). The individual patient values (open circles) and the medians (horizontal lines) are indicated. Day 0 refers to the baseline (precycle) value, and day 7 is the 7th day of the chemotherapy cycle.
