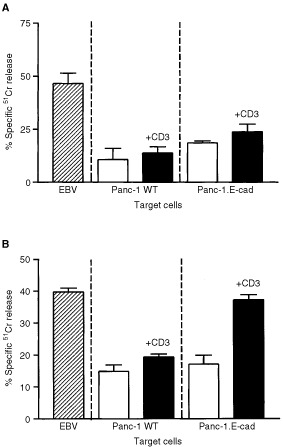
Figure 5.

Examination of cytolysis of Panc-1 cells by activated T cells with or without additional T cell receptor stimulation by CD3. (A) Assay performed using T cells from a day 9 MLR in the absence of exogenous TGFβ1. Hatched bar shows control cytolysis of the antigen-presenting cells used for T cell activation, open bars show Panc-1 lysis in the absence of CD3 stimulation and solid bars show the lysis produced following CD3 stimulation. The bars show the mean of 10-fold determinations; the error bars show the s.e.m. (B) Results of a similar assay performed using T cells harvested from an MLR performed in the presence of exogenous TGFβ1. The bars show the mean of 10-fold determinations; the error bars show the s.e.m.
