
Figure 1. IGF Signaling Components Are Expressed in the Developing Olfactory System.
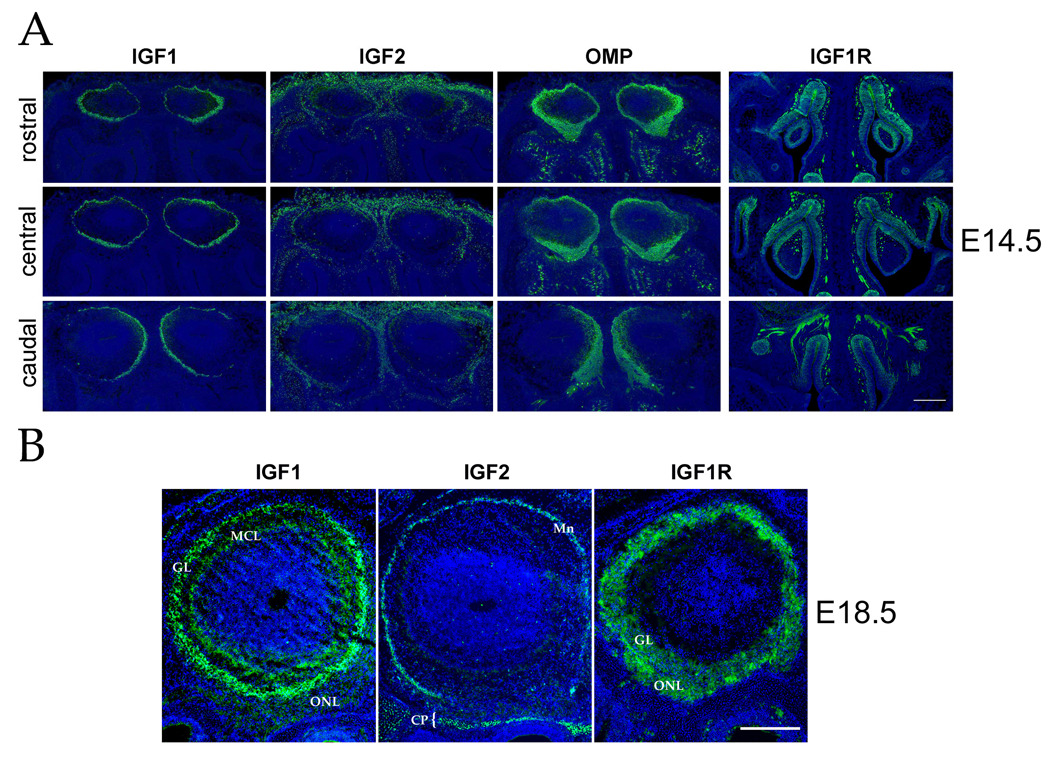
(A) Representative coronal tissue sections from the rostral, center, and caudal regions of the olfactory bulb and epithelium of E14.5 mice were labeled with IGF1, IGF2, IGF1R, or olfactory marker protein (OMP) antibodies. IGF1, IGF2 and OMP immunoreactivity (green) is shown from representative adjacent tissue sections taken at each position along the rostral-caudal axis. At this stage, IGF1 localizes in each bulb immediately inside the olfactory nerve layer (likely in the developing mitral cell and glomerular layers), showing a slight lateral > medial bias in expression rostrally and a pronounced medial > lateral bias caudally. IGF2 immunoreactivity is observed both in the overlying skin as well as in the leptomeninges of the olfactory bulb, with an exclusion from the ventral bulb. OMP expression – reflecting the disposition of the olfactory sensory axons in the olfactory nerve layer – reveals innervation roughly approximating the location of IGF1 in underlying bulb structures. In the olfactory epithelium, IGF1R is localized to immature and mature olfactory neurons throughout the olfactory sensory epithelium, as well as in the underlying olfactory axon fascicles (see Figure S1). (B) Coronal tissue sections of olfactory bulbs from E18.5 animals were analyzed by immunohistochemistry for IGF1, IGF2 and IGF1R expression. IGF1 is expressed in the mitral cell layer (MCL) and glomerular layer (GL) of the olfactory bulb. IGF2 is found in the leptomeninges (Mn) surrounding the bulb as well as in the bone of the cribriform plate (CP and bracket). Note that the expression of IGF2 in the leptomeninges does not completely surround the bulb in this tissue section. IGF1R localizes to the olfactory neuron axons within the olfactory nerve layer (ONL) as well as in the glomerular layer (GL). Nuclei of cells were visualized with Hoechst 33342 (blue). Dorsal is to the top in all panels; medial is to the right in panel B. Scale bar = 200 µm in panel A and 100 µm in panel B.