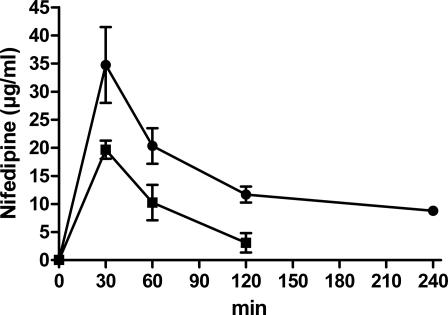
Figure 6.
Pharmacokinetics of nifedipine after s.c. and i.p. injection. 30 mg/kg nifedipine was injected s.c. or 15 mg/kg nifedipine i.p.. Mice were sacrificed at the times indicated (n = 3, for all groups), and blood was collected. The graph shows the concentration of nifedipine that was determined from 200 μL of serum. (Black circles) Injection with 30 mg/kg nifedipine s.c., (black squares) injection with 15 mg/kg nifedipine i.p. Data are expressed as mean and SEM.

