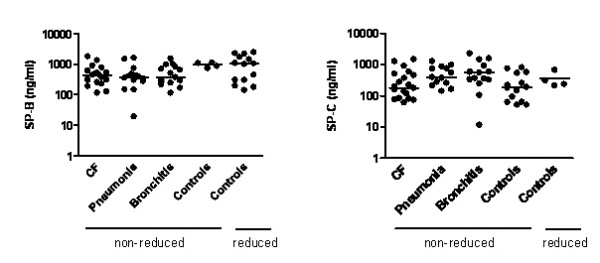
Figure 4.

Quantitative comparison of SP-B and SP-C, expressed per ml BAL fluid and obtained from analysis of Western blots of SP-B and SP-C under non-reducing and in the case of controls also und reducing conditions. By Kruskal Wallis Anova no significant differences were found between the four groups of subjects. Horizontal bar indicates median.
