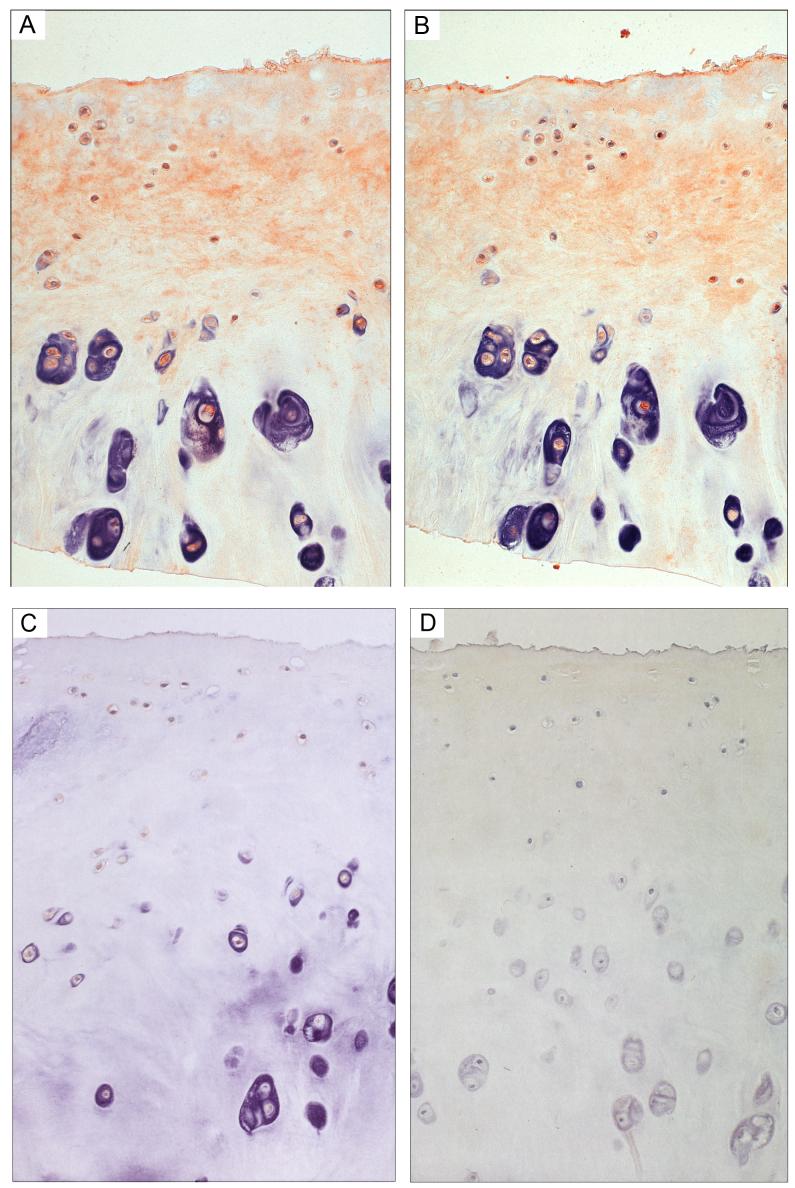
Figure 3. Immunohistochemistry for IGFBP-3 of Samples with Advanced Osteoarthritis.
Panels A and B show cartilage from a donor with a Mankin grade 9. Panel C shows a control of the same cartilage treated with antigen-blocked primary antibody (AG:AB molar ratio = 12:1), and D shows a second control in which the primary antibody was omitted. Full cartilage depth is shown in the sections, which were counter stained as in Figure 2. Magnification is ∼200x.

