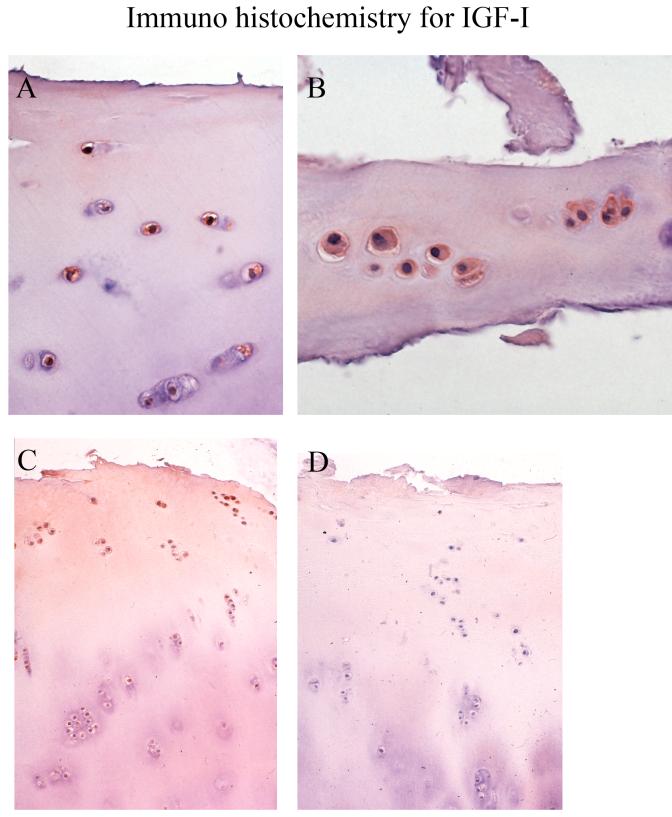
Figure 5. Immunohistochemical staining for IGF-I.
Panel A shows a normal cartilage, Panel B a severe OA cartilage and panels C and D are intermediate OA samples, with D being the minus antibody negative control. Panel A shows the approximate upper third of the cartilage, B is a full section of very thin residual cartilage in this severe OA sample, and panels C and D are full depth figures. Sections were counterstained as described in the legend to Figure 2. Magnification is 400x for panels A and B and 200x for C and D.

