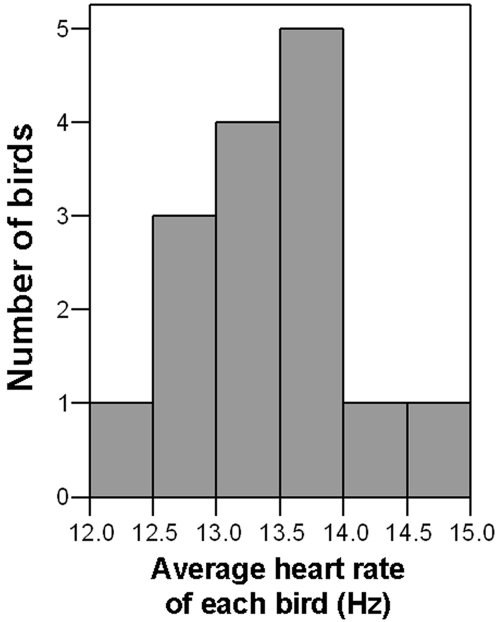
Figure 2. Frequency histogram for average heart rate.
The graph shows the average heart rates (mean±s.e.m., 13.35±0.18 Hz) of 15 free-flying Swainson's Thrushes migrating over the central United States in spring after initial ascent and prior to final descent. Note the large amount of variation. The histogram for the initial ascent phase (not shown) is virtually identical except the mean is higher: 14.43±0.16 Hz.

