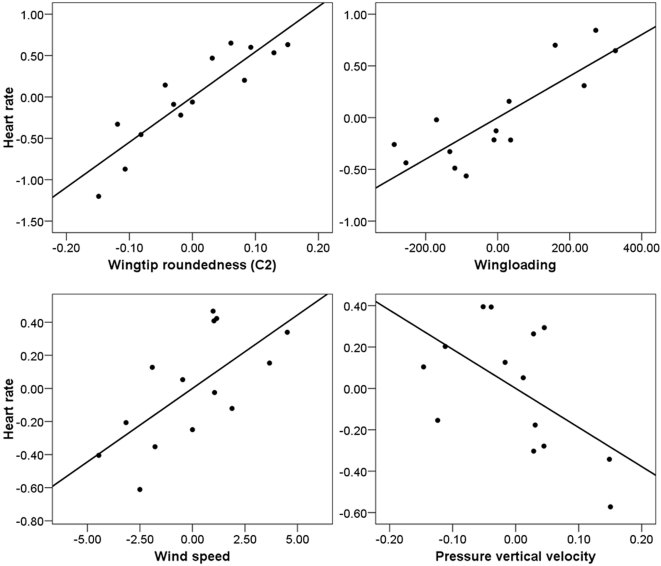
Figure 3. Partial regression plots for the cruise phase general linear model.
The dependent variable in the analysis was average heart rate (Hz) during the cruise phase of 14 migratory flights. Heart rate (and thus energy expenditure) increased with increasing wingtip roundedness (C2), wingloading (gm−2), and wind speed aloft (ms−1), independent of wind direction. It decreased with increasing pressure vertical velocity (increasing atmospheric stability, Pas−1), although not significantly. Axes are unstandardized residuals.

