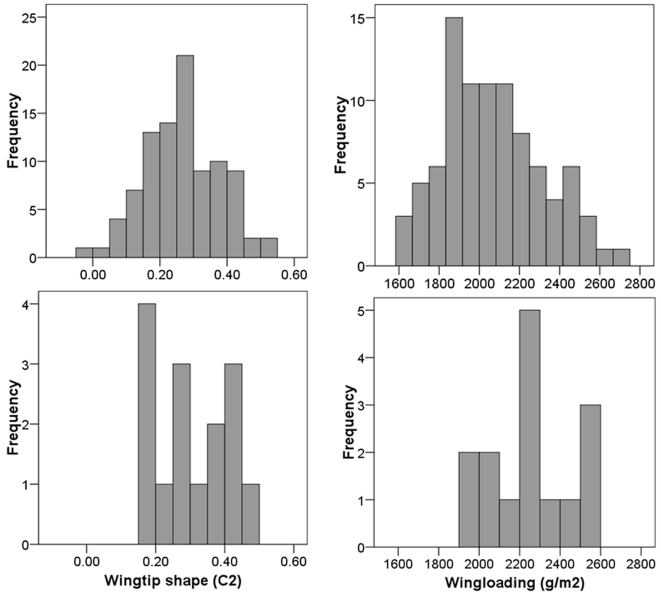
Figure 4. Frequency histograms for wingtip shape (C2, lower values indicate more pointed wings [3]) and wingloading.
The top graphs show the wingtip shapes and wingloadings of 93 Swainson's Thrushes captured in Champaign-Urbana, IL in May 2003–2005 [25] while the bottom graphs show the same data for the 15 Swainson's Thrushes followed in this study. Average wingloading is slightly higher in this study than in the larger sample primarily because of the added mass of the transmitter.

