
Figure 5. Pharmacokinetics of NKp30-Ig and NKp46D2-Ig fusion proteins in vivo.
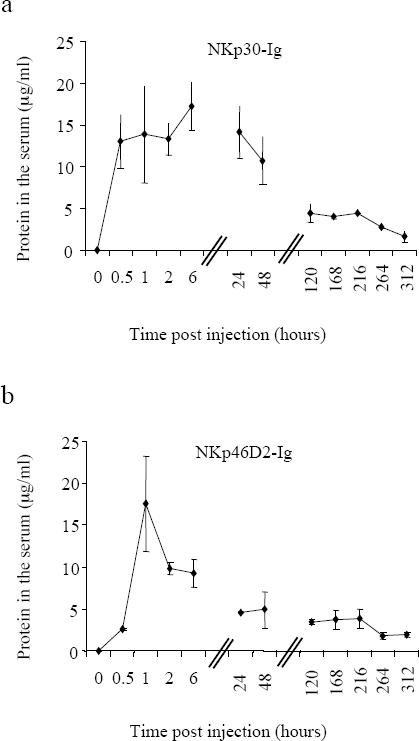
Mice were injected i.p. with one dose (5mg/kg) of NKp30-Ig (a) or NKp46D2-Ig (b). Serum sample were collected (at 0, 0.5, 1, 2, 6, 25, 48, 120, 168, 264 and 312 hours after injection) and levels of NKp30-Ig or NKp46D2-Ig were determined in a standard ELISA assay. Figure shows the average amount of fusion proteins detected in the serum of three mice, measure at each time point. Error bars represent mean±s.d of triplicates.