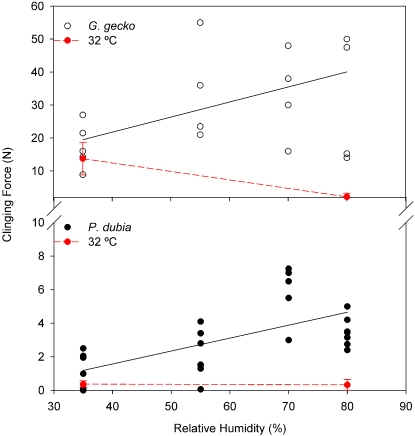
Figure 2. Adhesion at constant temperature of 12°C and variable relative humidity (RH).
Adhesion increased significantly with RH, but slopes were not significantly different. Red lines and symbols show results of 35% and 80% trials at 32°C designed to test for an interaction of temperature and humidity; error bars represent ±2 SE. See text for details (materials and methods).

