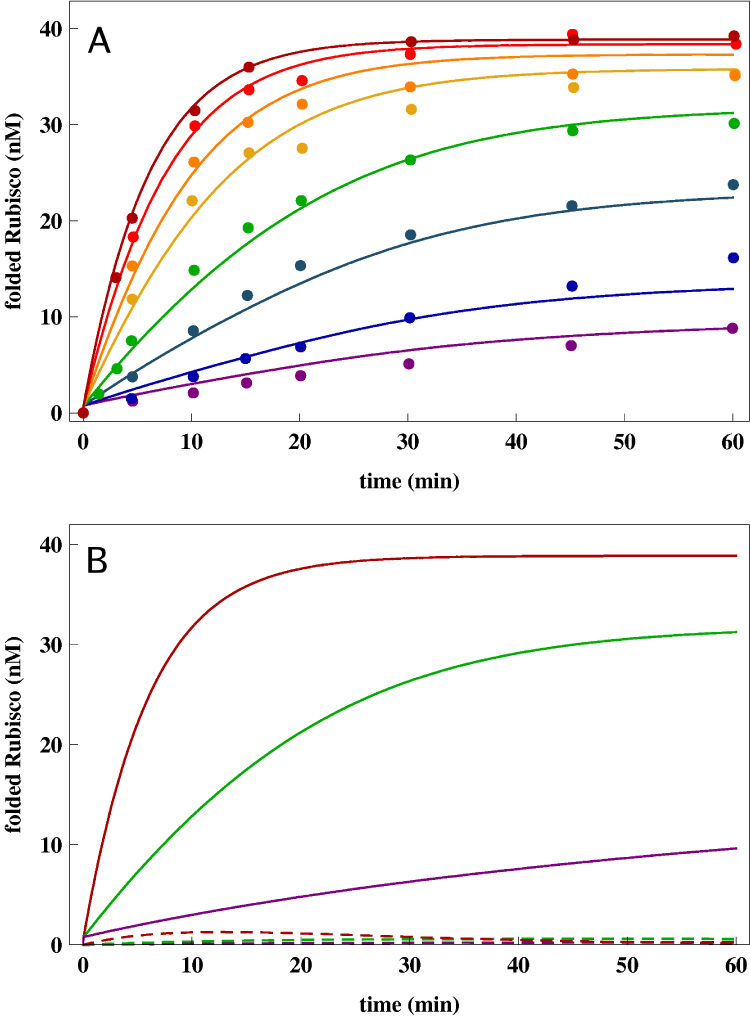
Figure 2.

(A) Native state yield of Rubisco as a function of time at different chaperonin concentrations. The points are experimental data from Ref. [19]. The lines are the fits to the data using the kinetic model. The set of parameters that provides a global fit to all eight data set is given in Table 1. The initial concentration of Rubisco is 40nM. The chaperonin concentrations for the curves from bottom to top are: EL0 = 1nM, EL0 = 2nM, EL0 = 5nM, EL0 = 10nM, EL0 = 20nM, EL0 = 30nM, EL0 = 50nM, EL0 = 100nM corresponding exactly to Ref. [19]. (B) Results of sensitivity analysis of the kinetic model (Eq. (12)) using Rubisco parameters (Appendix B). The time-dependent native state yield [N](t), solid curves, for three chaperonin concentrations, EL0 = 1nM, EL0 = 10nM, EL0 = 100nM, is compared to the robustness measure Δ[N](t), dashed curves (Eq. (23)). The small values of δ[N](t)/[N](t) for all t and at various [EL] concentrations suggest that the allosteric model is robust to changes in the kinetic parameters around the values that provide the best fit in (A).
