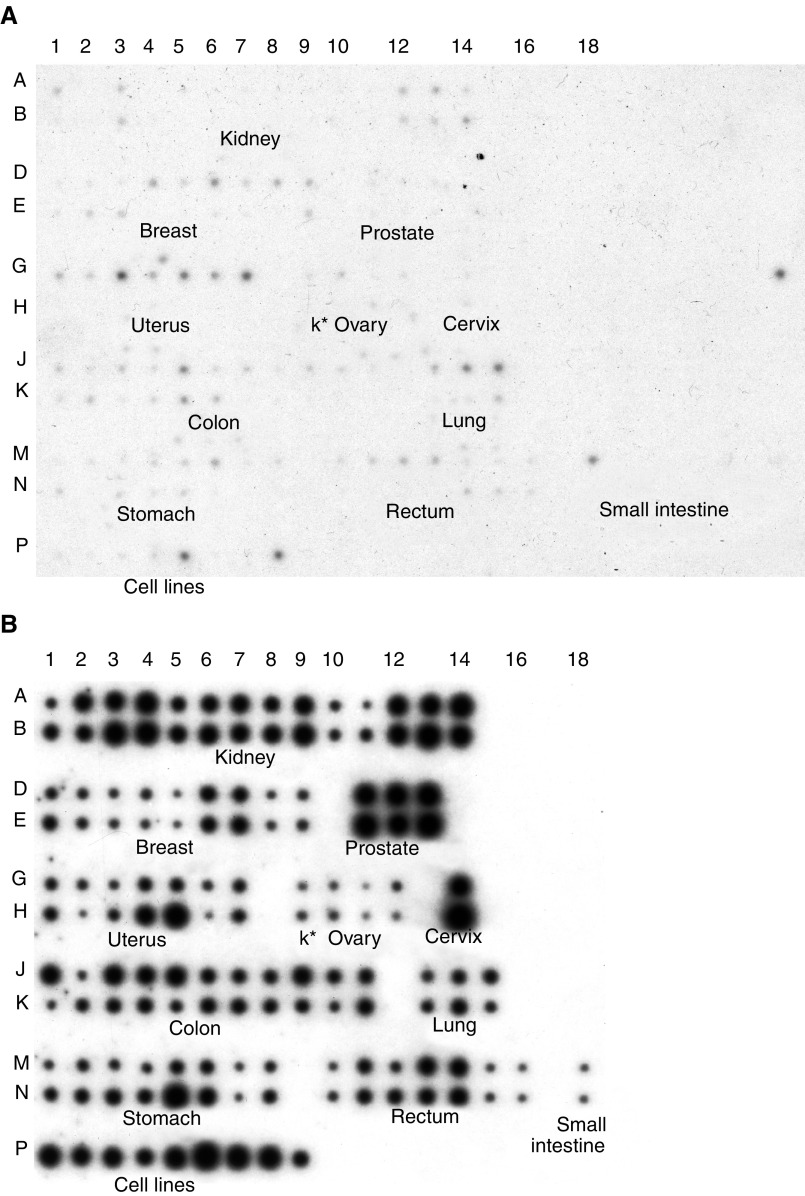
Figure 5.
Results obtained from hybridising the PASD1 cDNA (A) or the ubiquitin cDNA control probe (B) to BD Biosciences' MTN expression array. The identity and position of tissues on the array are shown. Rows A, D, G, J, and M are normal tissue while B, E, H, K, an N are tumour tissue, K*=kidney. Row P indicates the human cancer cell lines: 1 – HeLa, 2 – Daudi (Burkitt's lymphoma), 3 – K562 (chronic myeloid leukaemia), 4 – HL-60 (promyelocytic leukaemia), 5 – G361 (melanoma), 6 – A549 (lung carcinoma), 7 – MOLT-4 (lymphoblastic leukaemia), 8 – SW480 (colorectal adenocarcinoma), and 9 – Raji (Burkitt's lymphoma).

