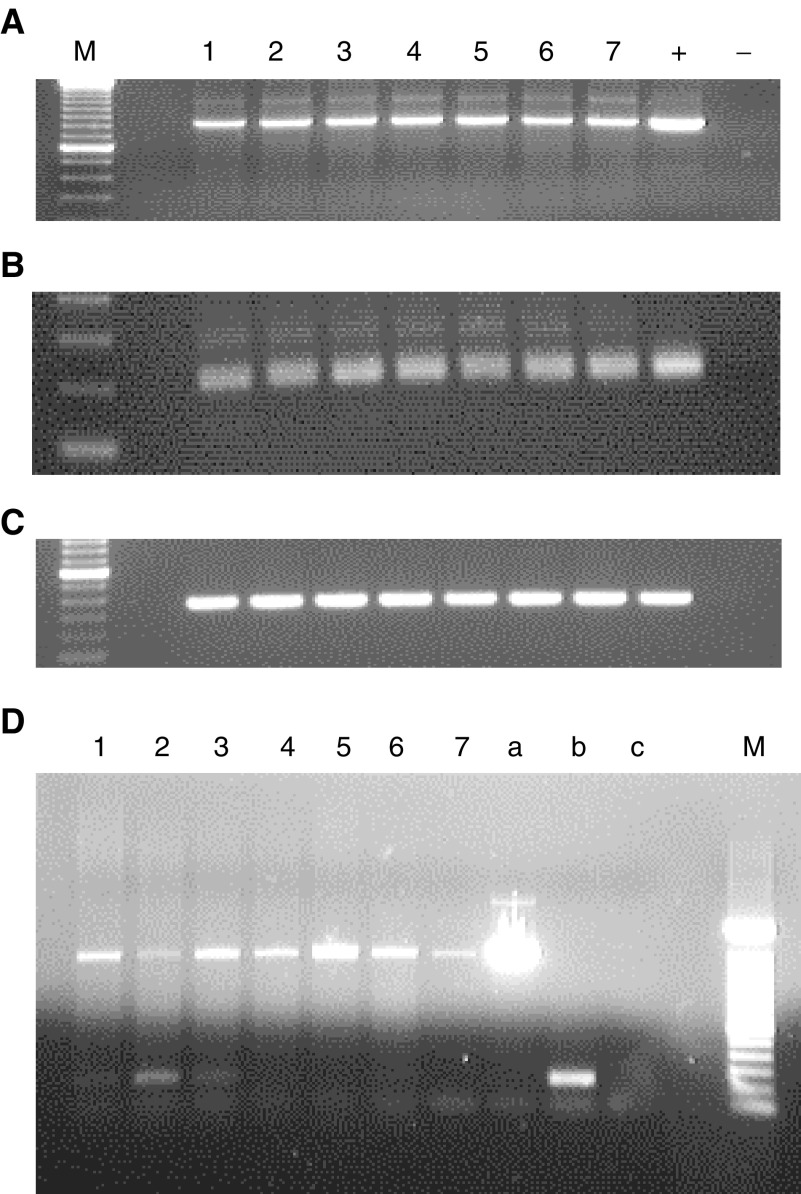
Figure 6.
PASD1 products amplified by RT–PCR from DLBCL cell lines: (A): β-actin control; (B): PCR with primer set A (detects both transcripts, same size product); (C): PCR with primer set B (PASD1_v1 specific): M=100 bp ladder; 1–7=cell lines (in order): OCI-Ly3; OCI-Ly10; HLY-1; SUDLH6; MIEU; LIB; DEAU; +=positive control; −=negative control; (D): PCR with primer set C (PASD1_v1 large product and PASD1_v2 small product) M=100 bp ladder; 1–6=cell lines (in order): OCI-Ly3; OCI-Ly10; HLY-1; SUDLH6; SUDHL10; DB; 7=genomic DNA; a=PASD1_v1 positive control; b=PASD1_v2 positive control; c=negative control.

