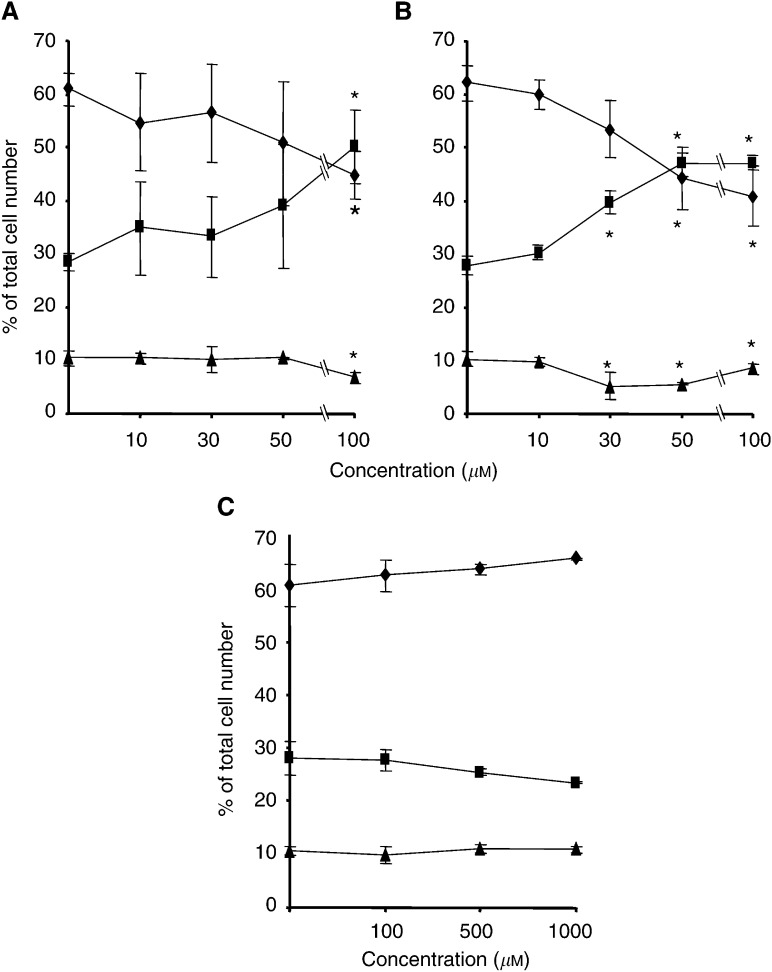
Figure 5.
Distribution in various phases of the cell cycle of cultured melanoma cells after bisphosphonate treatment. A375 cells were treated with (A) pamidronate, (B) zoledronate or (C) clodronate at the indicated concentrations for 24 h. DNA content of cells was determined by propidium iodide staining using FACS analysis, and the distribution of cells in G0/G1 (diamonds), S (squares) and G2/M (triangles) phases of the cell cycle is shown. Results are given as the percentage of cells in G0/G1, S and G2/M phases as determined by ModFitLT software (version 2.0). Values represent the mean of three independent experiments±s.d. (n=3) (*P<0.05).

