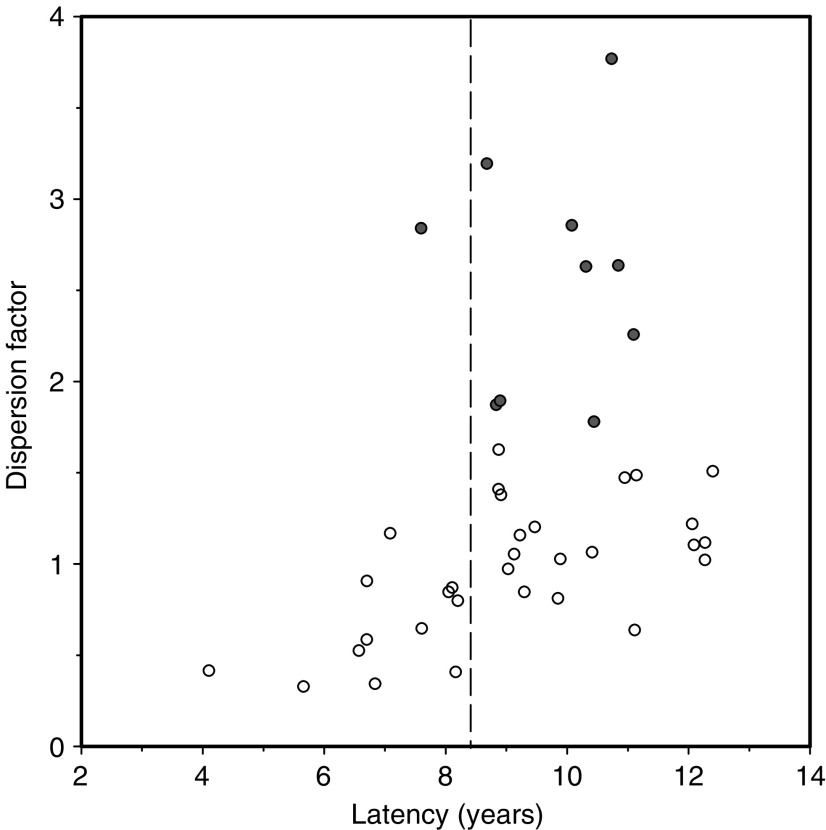
Figure 1.
Scatter plot showing the dispersion parameter for RET/PTC-rearranged cells within tumours against latency for each tumour patient. Filled circles represent significantly elevated dispersion factors indicating cases with a nonhomogeneous distribution of RET/PTC-rearranged cells within tumours. It is clearly visible from these diagrams that RET/PTC clustering occurs only in tumours with a latency of >8 years after the accident. These results are the basis for the discrimination in cases of short (4–8 years) and long (9–12 years) latency.

