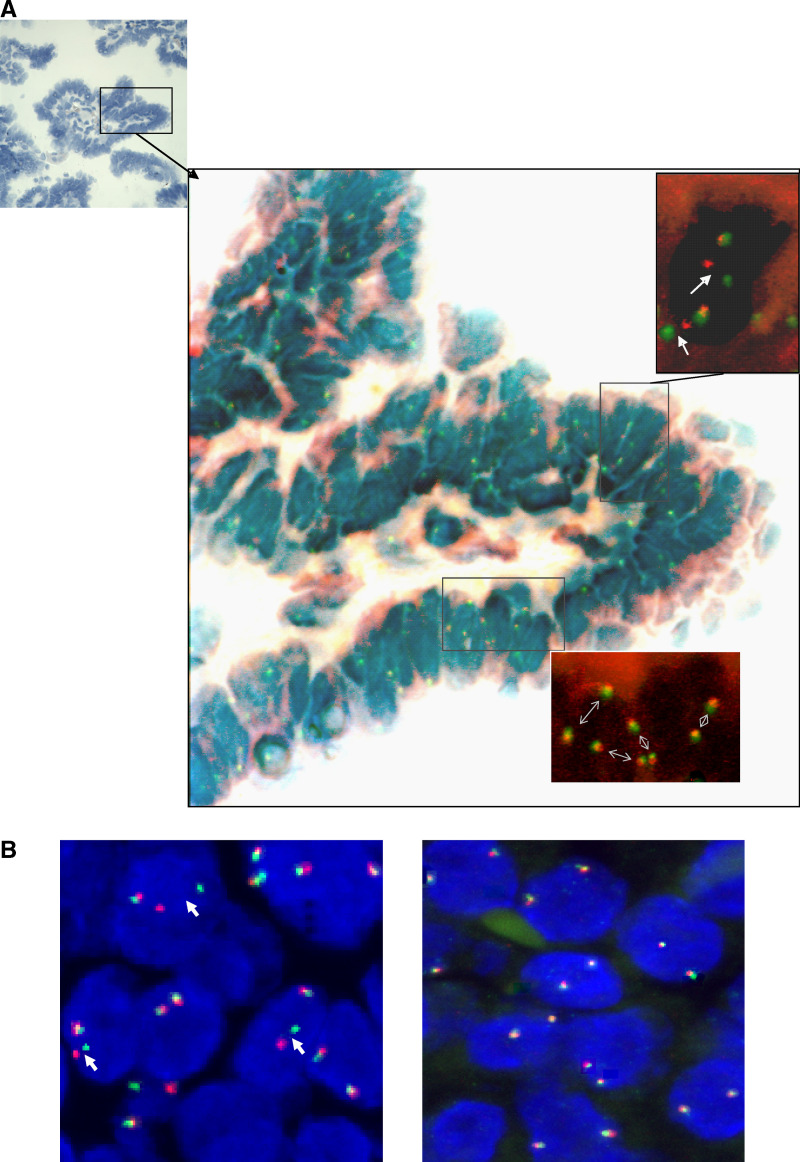
Figure 2.
FISH analysis with RET-specific DNA probes on paraffin sections using confocal LSM. (A) Hybridised section of case III stained simultaneously with hematoxylin to evaluate histologic features of the FISH-scored area. A papillary structure consisting of epithelial tumour cells in the vast majority. Examples of FISH-scored areas containing RET/PTC-rearranged and nonrearranged tumour cells are indicated. (B) Examples from two different tumour areas of the same case are demonstrated. One viewing area shows split FISH signals (arrows, left), and another viewing area shows only normal cells exhibiting overlapping FISH signals. All images are superimposed from approximately 10 different slices throughout the thickness of the tissue section.

