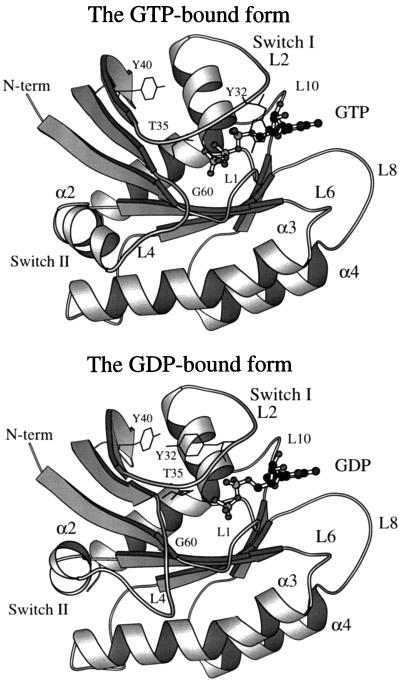
Figure 1.
Schematic representation of GTP- and GDP-bound structures; the structures are 5p21 (27) and 1q21 (28) in the Protein Data Bank. The nucleotides are represented by a ball-and-stick model. The side chains of Tyr-32 and Tyr-40 are shown to focus on an important conformational difference in the switch I region. This figure was generated with the molscript program (42).

