
Fig. 5.
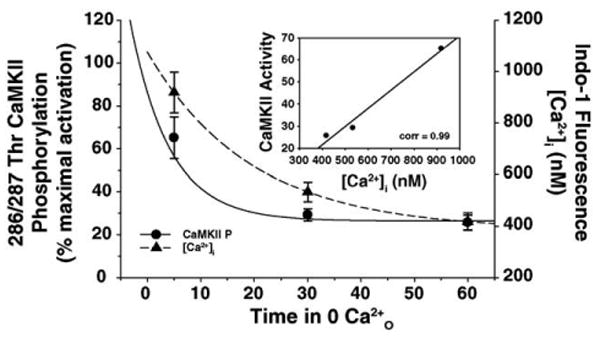
The decay in CaMKII phosphorylation correlates with the decrease in the peak Ca2+i response. Data presented in Fig. 2A and Fig. 4B were compared to demonstrate that CaMKII phosphorylation (●) decays proportionally to the decrease in the peak Ca2+i transient (▲) produced by 10 mM caffeine. Inset: scatter plot of CaMKII activity and peak Ca2+i demonstrate that both functions are well correlated (correlation value = 0.99).