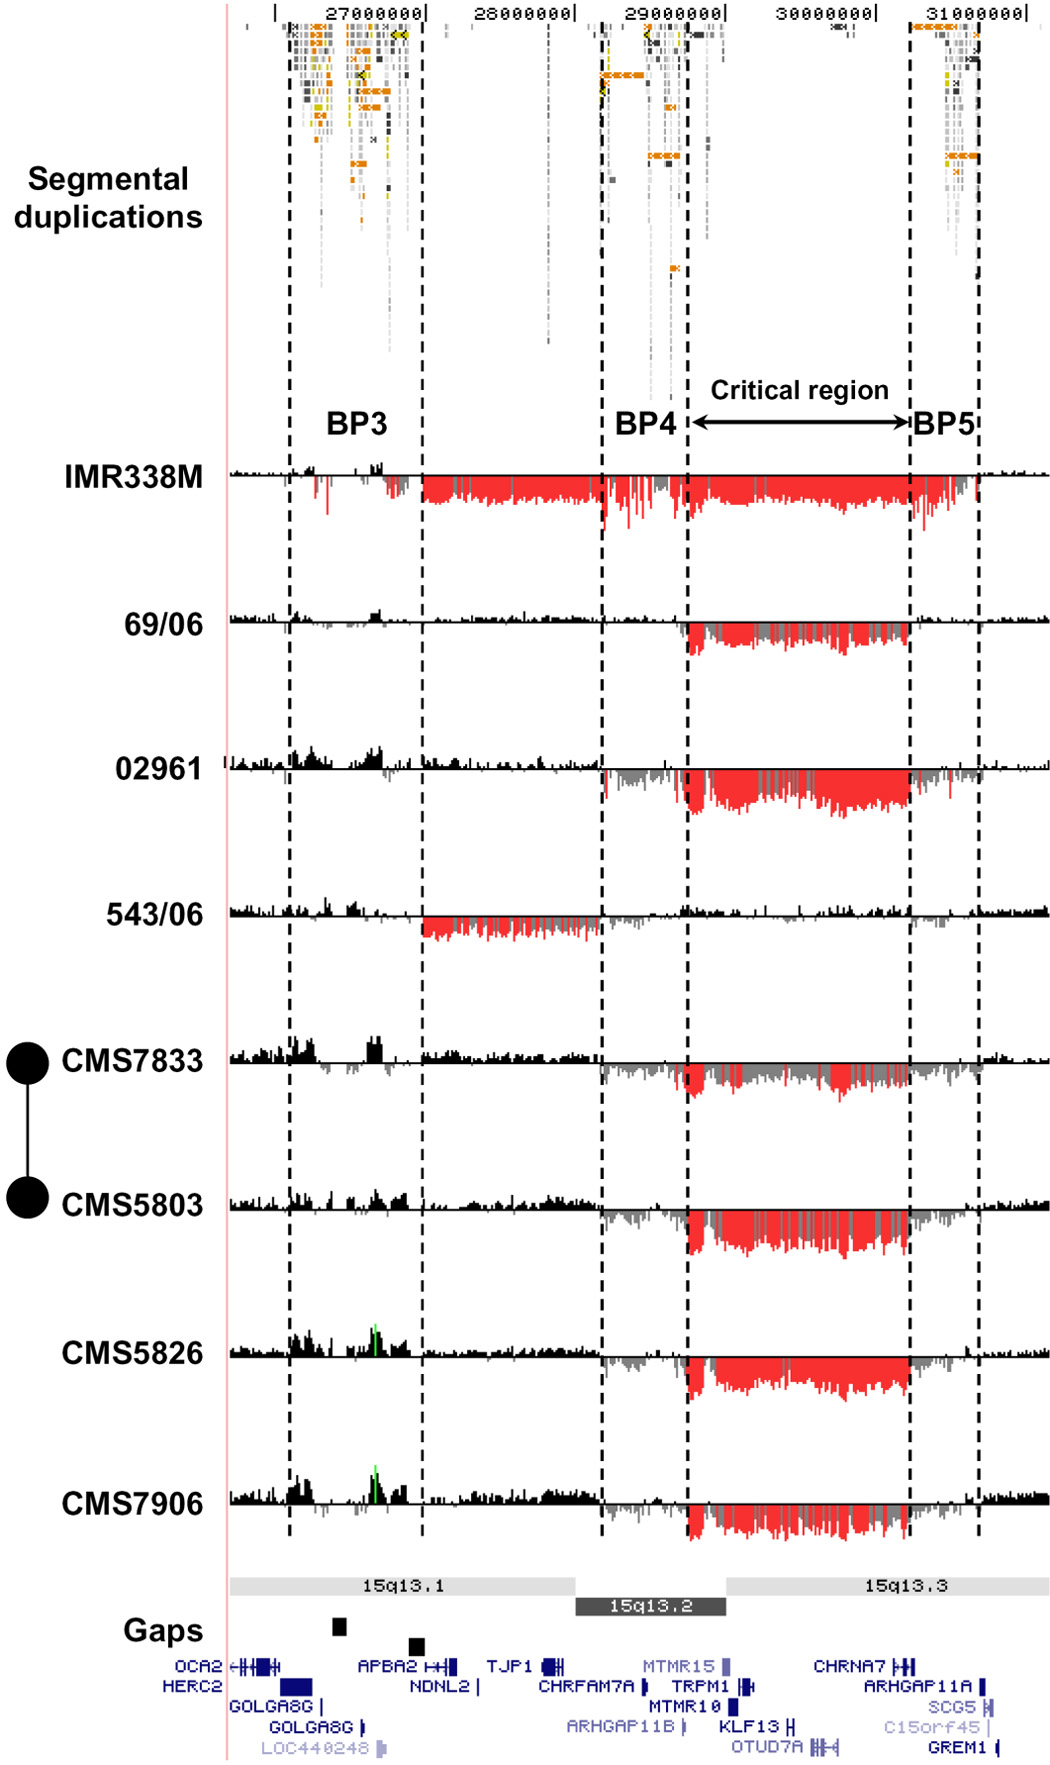
Figure 1.

High-resolution oligonucleotide array mapping of 15q12-q13.3 rearrangements (chr15:25,700,000–31,400,000). Although there appears to be variation in the exact location of breakpoints, all map to large blocks of segmental duplication at BP3, BP4, and BP5 (indicated by dashed lines). For each individual, deviations of probe log2 ratios from zero are depicted by grey/black lines, with those exceeding a threshold of 1.5 standard deviations from the mean probe ratio coloured green and red to represent relative gains and losses, respectively. Segmental duplications of increasing similarity (90–98%, 98–99%, and >99%) are represented by grey/yellow/orange bars, respectively. A number of other 15q rearrangements with breakpoints mapping to BP3, BP4, and BP5 are shown in Supplementary Figure 5.
